Figure 3.
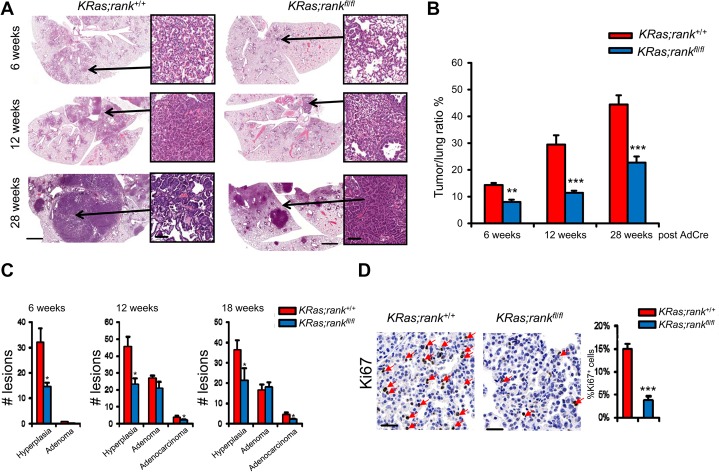
RANK controls lung tumor progression. (A) Representative histological lung sections and quantification of tumor to lung ratios of KRas;rank+/+ and KRas;rankfl/fl littermate mice 6, 12, and 28 wk after AdCre inhalation. Images are shown for each genotype at the indicated time points. Insets in A show typical neoplastic foci. Bars: whole-lung section, 2 mm; insets, 50 µm. (B) At all three time points analyzed, KRas;ranklfl/fl mice always exhibit significantly less tumor burden compared with their RANK-expressing littermate controls. n ≥ 8 mice per genotype at every indicated time point. (**) P < 0.01; (***) P < 0.001, χ2 test. (C) Quantification of hyperplasic regions, adenomas, and adenocarcinomas in KRas;rank+/+ and KRas;rankfl/fl lungs at the indicated time points following AdCre instillation. n ≥ 6 for each cohort and time point analyzed. Data are shown as means ± SEM. (*) P < 0.05, χ2 test. (D) Representative images and quantification of Ki67+ tumor cells in KRas;rank+/+ and KRas;rankfl/fl lung tumors analyzed 12 wk after AdCre infection. Quantification data are shown as mean ± SEM. n = 6. (***) P < 0.001, χ2 test.

