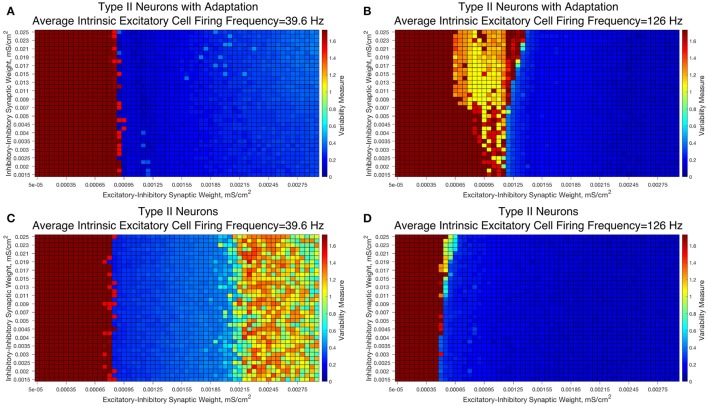
Figure 10.
E-I networks with Type II interneurons, both with and without an adaptation current, do not show significant change in dynamics as a function of I-I synaptic strength, unlike E-I networks with Type I interneurons. (A–D) Heatmaps showing the Variability Measure for networks with varying E-I synaptic strength on the x-axis and varying I-I synaptic strength on the y-axis. The average intrinsic cell firing frequency of the networks are set at 39.6 Hz in (A,C) and 126 Hz in (B,D). Results with inhibitory neurons modeled as a Type II neuron with adaptation are shown in (A-B), while results with inhibitory neurons modeled as a Type II neuron without adaptation are shown in (C,D). Neither networks with Type II with adaptation or Type II interneurons show the significant changes in dynamics as a function of the I-I synaptic weight that typified networks with Type I interneurons.

