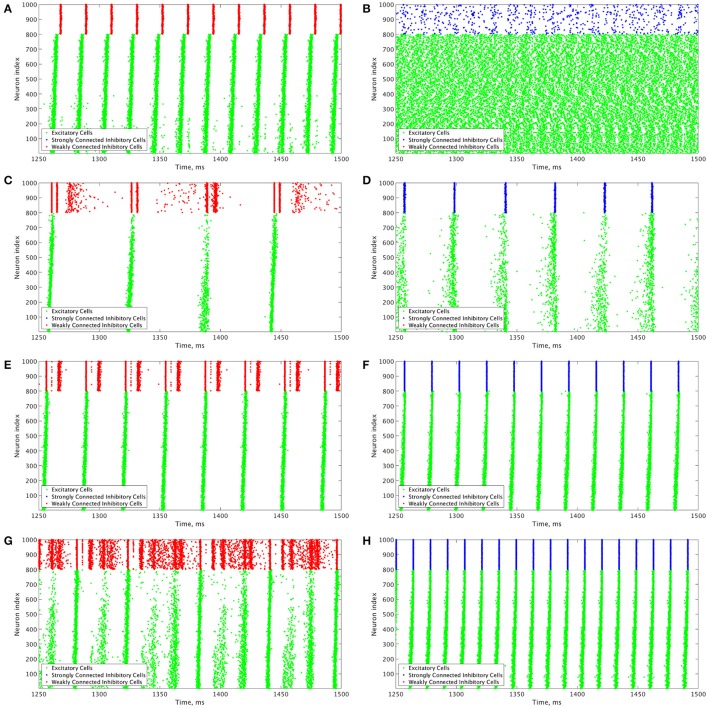
Figure 3.
Example raster plots illustrate the differences between dynamics in networks with weakly connected and strongly connected inhibitory subnetworks. (A–H) Example raster plots with the excitatory cells (green dots) in these raster plots organized such that cells with the highest external drive are given the lowest Neuron Indices with the rest of the neurons organized such that decreasing external drive corresponds with increased Neuron Index. Panel letter corresponds with overlaid labels in Figures 4, 5 indicating the parameters of the given network. (A,C,E,G) are from networks with weakly connected inhibitory subnetworks, while (B,D,F,H) are from networks with strongly connected inhibitory networks. (A,B) are raster plots from a network with an E-I synaptic weight of 0.0004 mS/cm2 and an average intrinsic excitatory cell firing frequency of 98.8 Hz. (C,D) Are raster plots from a network with an E-I synaptic weight of 0.00235 mS/cm2 and an average intrinsic excitatory cell firing frequency of 39.6 Hz. (E,F) are raster plots from a network with an E-I synaptic weight of 0.00235 mS/cm2 and an average intrinsic excitatory cell firing frequency of 80 Hz. (G,H) are raster plots from a network with an E-I synaptic weight of 0.00235 mS/cm2 and an average intrinsic excitatory cell firing frequency of 126 Hz.

