FIGURE 2.

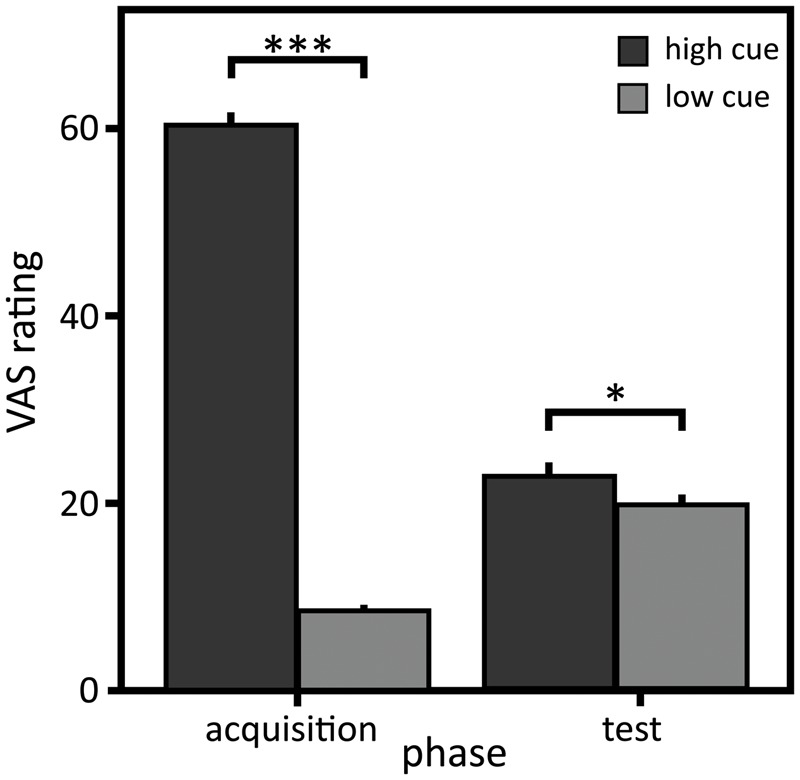
Visual analog scale (VAS) ratings of the perceived intensity. Mean and standard errors of mean of the VAS ratings for the high and low cue in the acquisition and the test sequence (N = 21). ∗p < 0.05; ∗∗∗p < 0.001.

Visual analog scale (VAS) ratings of the perceived intensity. Mean and standard errors of mean of the VAS ratings for the high and low cue in the acquisition and the test sequence (N = 21). ∗p < 0.05; ∗∗∗p < 0.001.