
FIGURE 3.
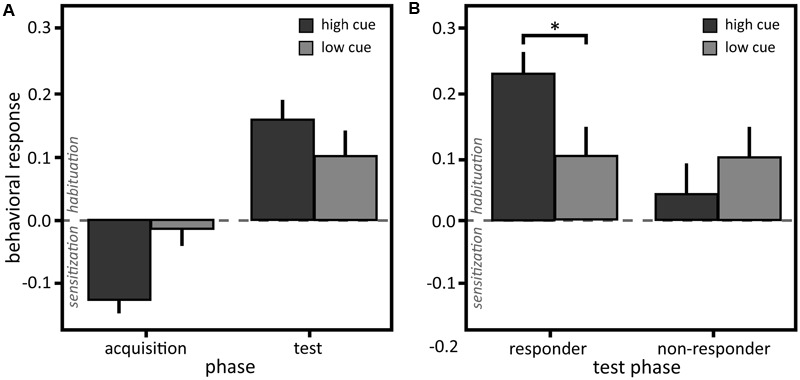
(A) Behavioral responses to the stimulation. Mean and standard errors of mean of the difference between self-adjusted temperature and initial temperature of the behavioral discrimination task for the high and low cue in the learning and test sequence of the whole sample (N = 21) and (B) of the responder (N = 13) and non-responder subgroups (N = 8) in the test sequence. ∗p < 0.05.