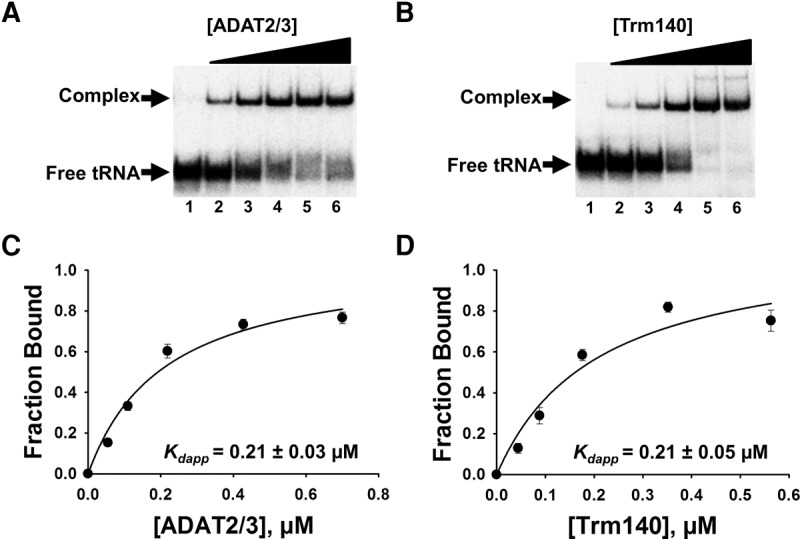
FIGURE 1.

TbADAT2/3 and TbTrm140 stably bind tRNA in vitro. Analysis of protein–tRNA interactions using EMSA where radioactively labeled tRNAThrCGU (2.5 nM) was incubated with increasing concentrations of enzyme and separated on a native acrylamide gel. (A) Representative EMSA of TbADAT2/3 incubated with tRNAThrCGU. Lane 1 is a no-enzyme control; lanes 2–6 show tRNA with an increasing concentration of TbADAT2/3 (0.06, 0.12, 0.24, 0.48, and 0.7 µM, respectively). (B) EMSA of TbTrm140 incubated with tRNAThrCGU. Lane 1 is a no-enzyme control; lanes 2–6 show tRNA with an increasing concentration of TbTrm140 (0.04, 0.08, 0.16, 0.32, and 0.56 µM, respectively). The fraction of total bound tRNA from the EMSA gels was quantified and plotted as a function of protein concentration. The data were fit to a single-ligand binding isotherm and the apparent dissociation constant (Kdapp) was determined as described in Materials and Methods. These graphs are shown in (C) TbADAT2/3 with tRNAThrCGU and (D) TbTrm140 with tRNAThrCGU. Each figure represents at least five independent replicates.
