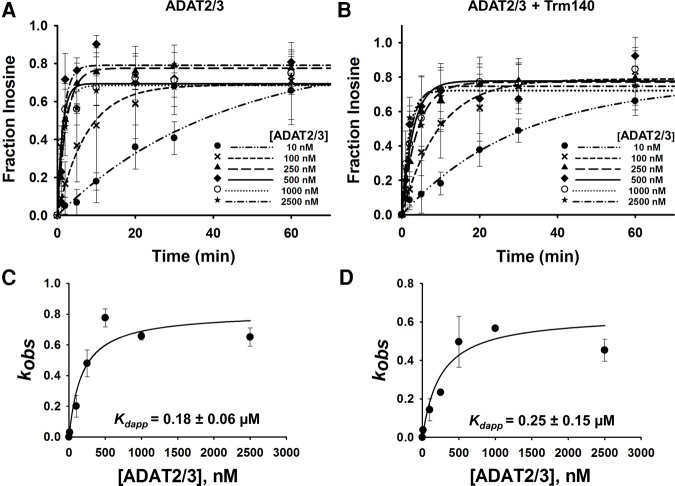
FIGURE 5.
Kinetic determination of the dissociation constant of TbADAT2/3 for tRNAThr in the presence of TbTrm140. Single turnover assays of (A) TbADAT2/3 with tRNAThrCGU alone and (B) in the presence of TbTrm140 were performed as described in Materials and Methods. The fraction of inosine formed for each TbADAT2/3 protein concentration ranging from 10 to 2500 nM was measured over time as indicated in the graph. Determination of dissociation constants for (C) TbADAT2/3 with tRNAThrCGU alone and (D) in the presence of TbTrm104. The fraction of inosine produced was plotted as a function of time and fit to a single exponential curve [f = a(1 − e−kt)], where f represents inosine formed, a denotes inosine produced at the end point of the reaction, k signifies kobs, and t is time. The resulting kobs values were plotted against the concentration of TbADAT2/3 and fit to a single ligand binding isotherm. The Kdapp was then determined by nonlinear regression using Sigmaplot. Each graph represents at least five independent replicates.

