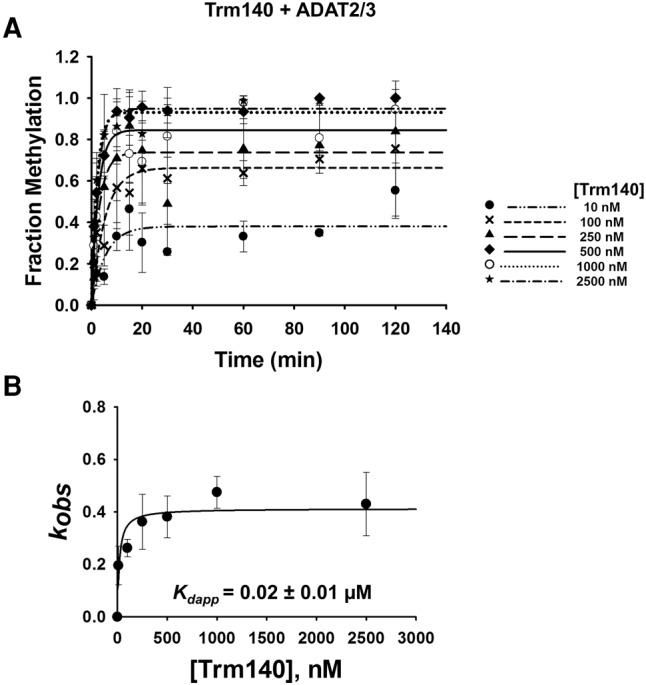
FIGURE 6.

Kinetic determination of dissociation constant of TbTrm140 to tRNAThr in the presence of TbADAT2/3. (A) Single turnover assays of TbTrm140 to tRNAThrCGU in the presence of TbADAT2/3 were performed as described in Materials and Methods. The fraction of methylated cytosine 32 was measured for each TbTrm140 protein concentration ranging from 10 to 2500 nM as shown in the graph. The methylated fraction was plotted as a function of time and fit to a single exponential curve [f = a(1 − e−kt)], where f represents methylated cytosine formed, a denotes methylated cytosine produced at the end point of the reaction, k signifies kobs, and t is time. (B) The resulting kobs values were plotted against the concentration of TbTrm140 and fit to a single ligand binding isotherm. The Kdapp was then determined by nonlinear regression using Sigmaplot. Each graph represents at least five independent replicates.
