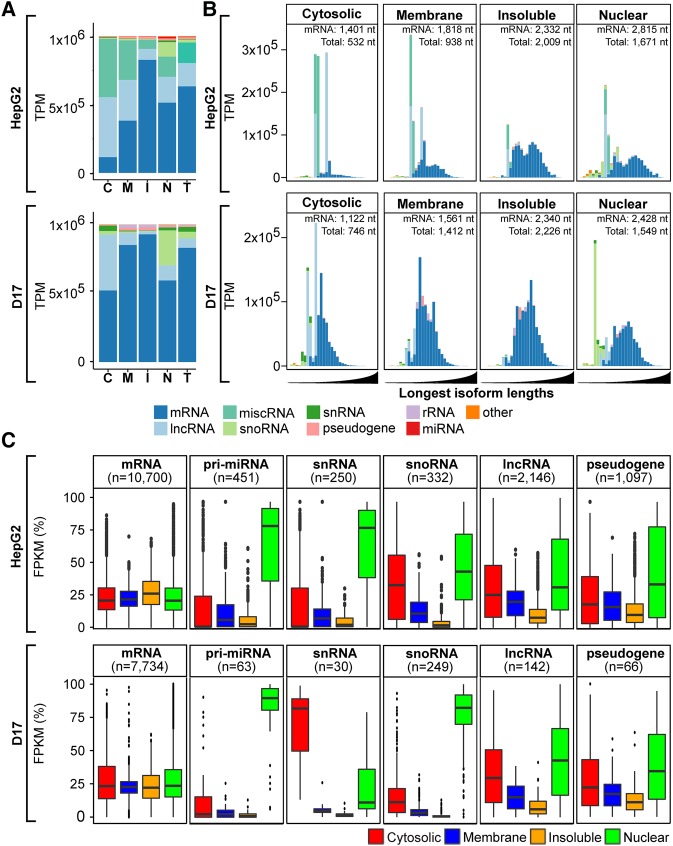
FIGURE 2.
Distinctive transcript composition of subcellular fractions in rRNA-depletion data set. (A) Histograms depicting the RNA biotype content, in TPM, detected via RD sequencing of cytosolic (C), membrane (M), insoluble (I), and nuclear (N) fractions or whole-cell RNA ([T] total) from HepG2 (upper panel) and D17 cells (lower panel). (B) Histograms of the RNA biotype content of HepG2 (upper panel) and D17 (lower panel) cell fractions, binned according to the length of the longest annotated isoform of detected RNA species, following a log10 scale from 1.5 to 5 (i.e., ranging from 31 to 100,000 nt). The expected lengths for mRNA and total RNA populations are indicated for each fraction. For A and B, biotypes accounting for <1% of the overall TPMs were grouped as “other.” (C) Boxplots showing the fraction distribution profiles of different RNA biotypes in percent FPKM (pFPKM) for HepG2 (upper panel) and D17 (lower panel) cells. The number (n) of transcripts analyzed for each biotype is indicated.

