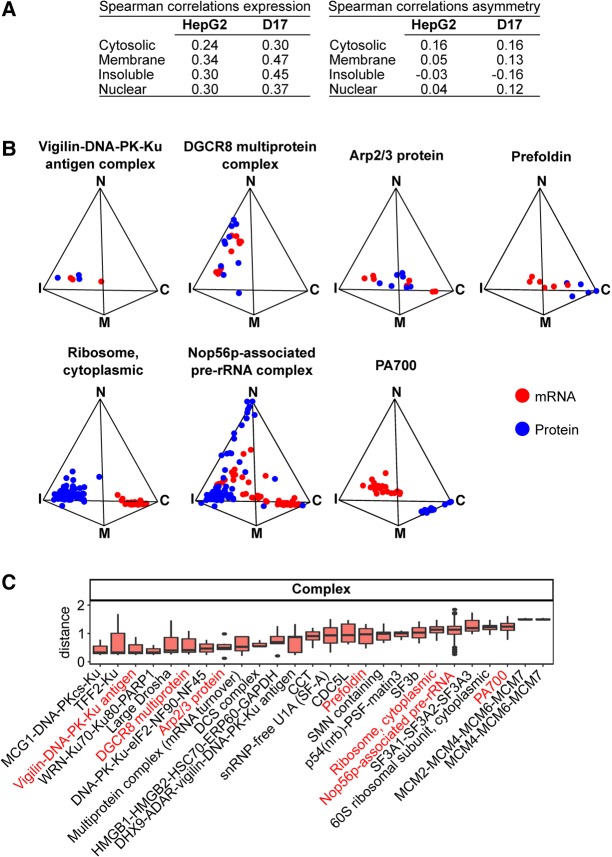
FIGURE 6.
Proteins are asymmetrically detected in each fraction in patterns that demonstrate specific colocalization with mRNA for a specific subset of genes. (A) Summary table of the Spearman correlation values of mRNA/protein expression (left) and mRNA/protein asymmetry (right) within the indicated HepG2 and D17 fractions. (B) Simplex graphs depicting the relative distribution profiles of components of different protein complexes (blue) and their corresponding mRNAs (red). (C) Boxplot of the distance measurement scores of protein components of specific biochemically defined protein complexes and their corresponding mRNAs. (C) Cytosolic, (M) membrane, (I) insoluble, (N) nuclear.

