Figure 2.

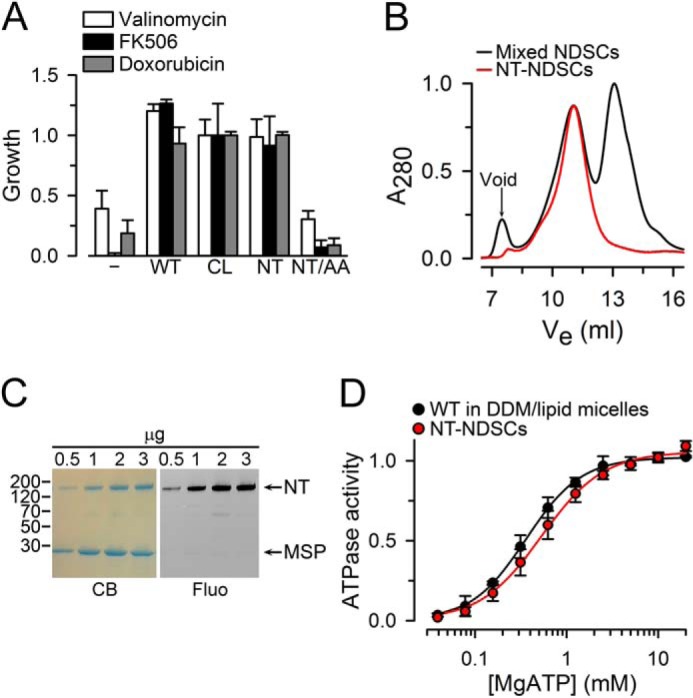
Characterization of NT Pgp. A, drug resistance assay in S. cerevisiae. The relative growth of cells transformed with the pVT vector control (−) and cells expressing wild-type Pgp (WT), Cys-less Pgp (CL), the N607C/T1252C (NT), or E552A/E1197A (NT/AA) mutants was monitored in the presence of 100 μm valinomycin, 62 μm FK506, or 40 μm doxorubicin for 25–30 h at 28 °C. Data were normalized to the CL Pgp average and are presented as means ± S.D. of three independent experiments performed in duplicate. B, size-exclusion chromatography elution profile of NT Pgp purified and reconstituted in lipid nanodiscs. The two main peaks of the black trace correspond to NDSCs containing Pgp (Ve ∼11 ml; Ve, elution volume) and empty NDSCs (Ve ∼13 ml). The red trace corresponds to NT Pgp in NDSCs (NT-NDSCs) purified by affinity chromatography (anti-FLAG M2 affinity gel) from the mixed NDSCs. C, NT Pgp in NDSCs. Coomassie-stained SDS-polyacrylamide gel (CB) and the corresponding fluorescent image (Fluo) of the fraction enriched in NDSCs containing NT Pgp labeled with Bodipy FL. Arrows point to the NT Pgp (NT) and MSP bands. Molecular masses of selected markers, in kDa, are shown on the left. D, ATPase activity measured in the presence of 30 μm verapamil. Data are averages ± S.E. of at least three independent experiments. Lines represent fits to the Hill equation, with Hills coefficients of 2 and 1.8 for WT Pgp and NT Pgp, respectively. Vmax and Km values were not significantly different between WT Pgp (Vmax = 3.9 ± 0.4 μmol/min/mg; Km = 0.31 ± 0.03 mm) and NT Pgp (Vmax = 4.1 ± 0.5 μmol/min/mg; Km = 0.27 ± 0.02 mm).
