Figure 5.

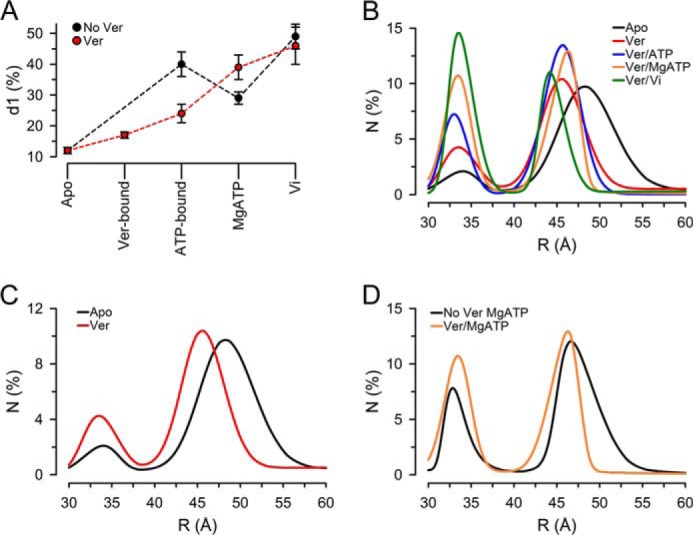
Distance distributions of NT Pgp in NDSCs at 37 °C in different states during the hydrolysis cycle. A, percentage of NT Pgp molecules displaying the shorter distance (d1, ∼33 Å). Means ± S.E. in the absence (No Ver; n = 7) and presence of Ver (n = 5) were calculated from the multiexponential fits results (Table 1) as the fractional intensity contribution of each exponential component divided by the rate of energy transfer (k = 1/τDA − 1/τD). B, distance distributions calculated from LRET-sensitized emission intensity decays analyzed by an exponential series method. N, % molecules. The percentage of molecules in each conformation, calculated as described in the legend to A, was adjusted based on the cumulative number of molecules versus donor/acceptor pair distance obtained from the exponential series method analysis. See “Experimental procedures” and supplemental Fig. 8 for details. Solid lines correspond to the best fits obtained using Peak Fit (Systat Software Inc., San Jose, CA). Apo, nucleotide- and drug-free buffer with 1 mm EDTA; Ver, +30 μm Ver; Ver/ATP-bound, +5 mm NaATP; Ver/MgATP, +10 mm MgSO4; Ver/Vi, + 0.25 mm Vi. C, comparison of distance distributions in the apo-state (No Ver) and in the presence of Ver (Ver). D, comparison of distance distributions during hydrolysis in the absence (MgATP) and presence of Ver (Ver/MgATP). Data from NT Pgp in NDSCs at 37 °C were used for all calculations. The curves in B--D are averages from five independent experiments.
