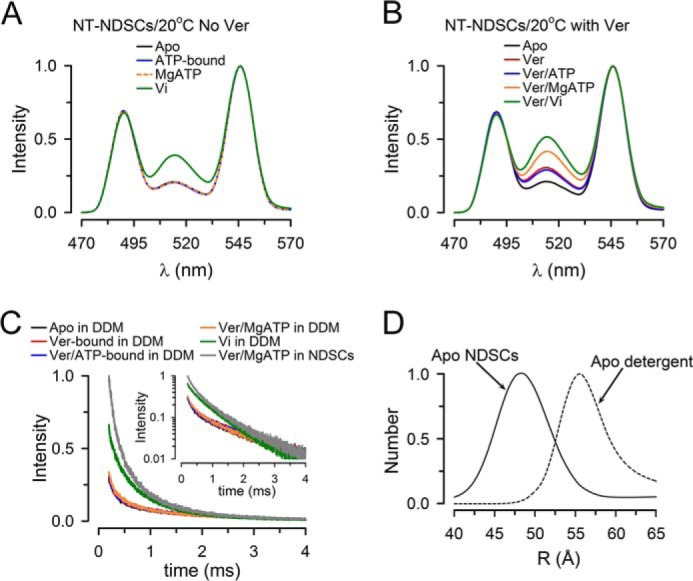
Figure 6.

Conformational changes during the ATP hydrolysis cycle of NT Pgp in NDSCs at 20 °C. A, emission spectra from NDSCs containing NT Pgp measured in the absence of Ver. Apo, nucleotide- and drug-free buffer with 1 mm EDTA; ATP-bound, +5 mm NaATP; MgATP, +10 mm MgSO4; Vi, +0.25 mm Vi. B, emission spectra from NDSCs containing NT Pgp measured in the presence of Ver. Apo, nucleotide- and drug-free buffer with 1 mm EDTA; Ver, +30 μm Ver; Ver/ATP-bound, +5 mm NaATP; Ver/MgATP, +10 mm MgSO4; Ver/Vi, +0.25 mm Vi. C, Bodipy FL sensitized emission decays from NT Pgp in detergent (0.1% DDM) or NDSCs. The inset displays the same curves in a semi-log scale. Decays were normalized to the emission at 200 μs of NT Pgp in NDSCs in the Ver/MgATP state. D, distribution of Pgp molecules displaying the d2 distance (longer distance) determined at 20 °C in the apo-state of NT Pgp in DDM and in NDSCs. The y axis represents the relative number of molecules displaying the d2 distance. All the traces shown in these figures are representative of at least three independent experiments and were obtained at 20 °C. Emission was recorded after a 200-μs delay from the 337-nm excitation pulse. See legend to Fig. 3 for details.
