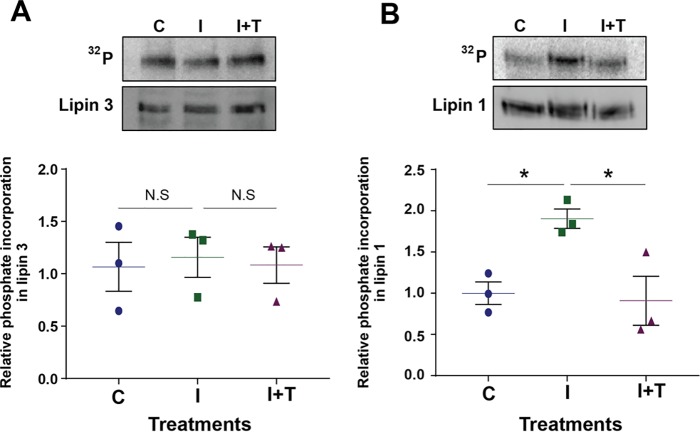
Figure 3.
Phosphorylation of lipin 3 in 3T3-L1 cells. A, 3T3-L1 cells infected with adenovirus expressing FLAG-lipin 3 were serum-starved in low-phosphate buffer for 2 h, incubated with 0.2 mCi/ml orthophosphate, and treated as indicated. The cells were harvested, incubated with anti-FLAG beads for 4 h, displaced from beads, and separated on an SDS-polyacrylamide gel and transferred to PVDF. Top, a phosphor image of 32P incorporation into lipin 3 (top; 32P) and an immunoblot image of total lipin 3 protein (bottom; lipin 3). Bottom, quantitation of three independent experiments. B, the experiment was performed as in A, but with FLAG-lipin 1. Shown are scatter plots with mean of the quantitation of three independent experiments ± S.E. (error bars). One-way ANOVA was used to analyze statistical significance followed by Sidak post hoc analysis. *, p < 0.05; N.S., no statistical significance.

