Figure 1.
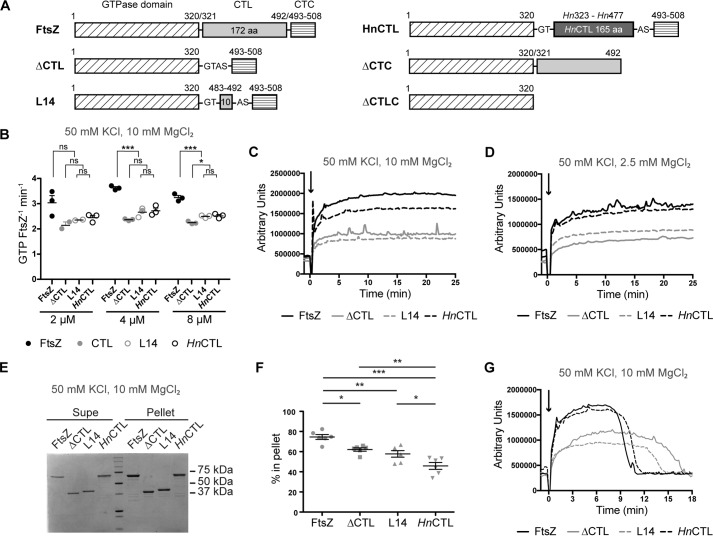
CTL affects FtsZ polymer dynamics. A, schematic showing different regions of FtsZ truncations and CTL variants. The numbers shown above the schematic correspond to the amino acid numbers in wild type (CcFtsZ). Hn323–Hn477 represent amino acid numbers in H. neptunium FtsZ. (G, T, A, and S represent amino acids Gly, Thr, Ala, and Ser introduced due to restriction sites added for cloning). B, GTP hydrolysis rates of CTL variants at 2, 4, and 8 μm concentrations with 2 mm GTP, 50 mm KCl, and 10 mm MgCl2. Line and error bars represent average and standard deviation, respectively. *, p < 0. 05; **, p < 0.01; ***, p < 0.001; ns, p > 0.05 for Tukey's multiple comparison test (one-way analysis of variance). C, right angle light scatter at 350 nm over time for 4 μm FtsZ CTL variants with 2 mm GTP (added at time = 0 min) and 10 mm MgCl2 (mean of three replicates). D, right angle light scatter at 350 nm over time for 4 μm FtsZ CTL variants with 2 mm GTP (added at time = 0 min), 50 mm KCl, and 2.5 mm MgCl2 (mean of at least three replicates). E, representative Coomassie-stained SDS-polyacrylamide gel of a pelleting assay showing relative amounts of FtsZ CTL variants in supernatant (Supe) or pellet for 4 μm FtsZ CTL variant with 2 mm GTP, 50 mm KCl, and 10 mm MgCl2, 15 min after addition of GTP. F, quantification of the percentage of FtsZ CTL variants in pellet corresponding to experiment in E (n = 6). *, p < 0. 05; **, p < 0.01; ***, p < 0.001 for non-parametric t tests. G, right angle light scatter at 350 nm over time for 4 μm FtsZ CTL with 0.5 mm GTP (added at time = 0 min), 50 mm KCl, and 10 mm MgCl2.

