Figure 10.
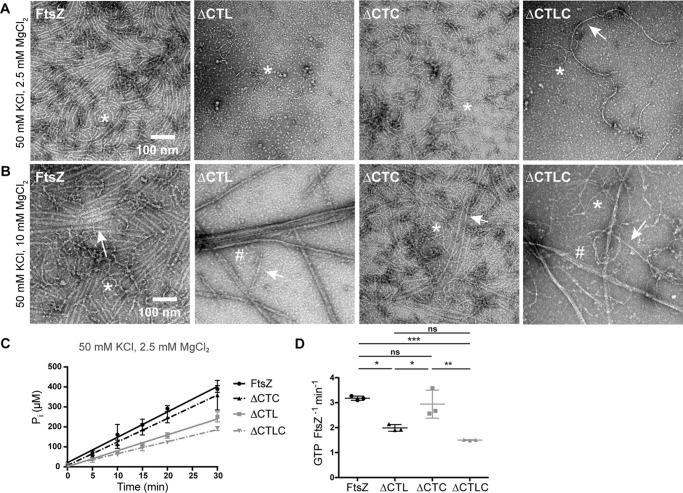
ΔCTL bundles form independent of the CTC. A and B, electron micrographs of polymers formed by 4 μm FtsZ, ΔCTL, ΔCTC, or ΔCTLC with 2 mm GTP and 2.5 mm MgCl2 (A) or 10 mm MgCl2 (B) spotted on grids 15 min after addition of nucleotide and stained with uranyl formate. Scale bar, 100 nm. *, single protofilaments; arrow, two- or three-filament bundles; #, multifilament bundles. C, inorganic phosphate (Pi) concentration in solution over time for reactions containing 4 μm FtsZ, ΔCTL, ΔCTC, or ΔCTLC with 2 mm GTP and 2.5 mm MgCl2 (n = 3). Error bars represent standard deviation. Straight lines indicate linear fits of averages. D, comparison of GTP hydrolysis rates (determined as the slope of linear fit for matched replicates of inorganic phosphate concentration over time) corresponding to the experiment in C. *, p < 0.05; **, p < 0.01; ***, p < 0.001; ns, p > 0.05 for Tukey's multiple comparison test (one-way analysis of variance).

