Figure 6.
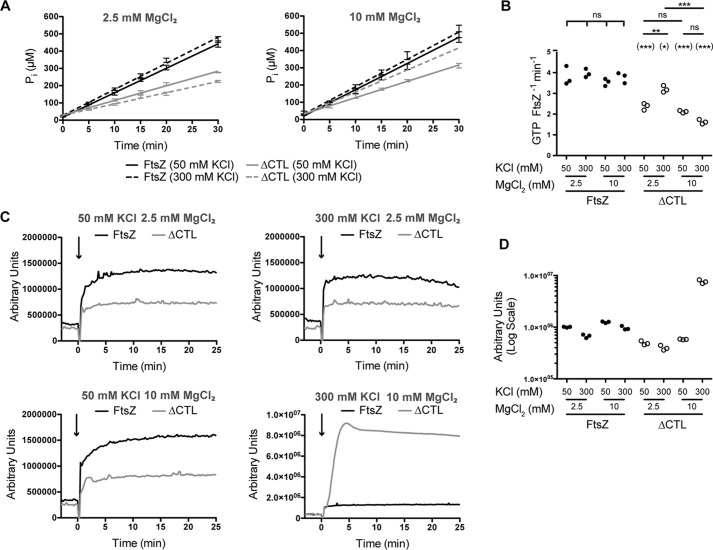
Effect of salt concentrations on FtsZ or ΔCTL polymerization dynamics. A, inorganic phosphate (Pi) concentration in solution over time in reactions containing 4 μm FtsZ or ΔCTL with 2 mm GTP at 2.5 mm MgCl2 or 10 mm MgCl2, and 50 mm KCl or 300 mm KCl concentrations. Error bars represent standard deviation. Straight lines indicate linear fits of averages. B, comparison of GTP hydrolysis rates (determined as the slope of linear fit for matched replicates of inorganic phosphate concentration over time) for FtsZ or ΔCTL corresponding to experiments in A. *, p < 0. 05; **, p < 0.01; ***, p < 0.001; ns, p > 0.05 for Tukey's multiple comparison test (one-way analysis of variance). C, right angle light scatter at 350 nm over time for 4 μm FtsZ or ΔCTL with 2 mm GTP (added at time = 0 min) at 2.5 mm MgCl2 or 10 mm MgCl2 and 50 mm KCl or 300 mm KCl concentrations. D, extent of light scatter (quantified as the difference between light scatter at steady state (time = 25 min) and light scatter prior to addition of nucleotide (time = −1 min) for FtsZ or CTL corresponding to experiments in C.

