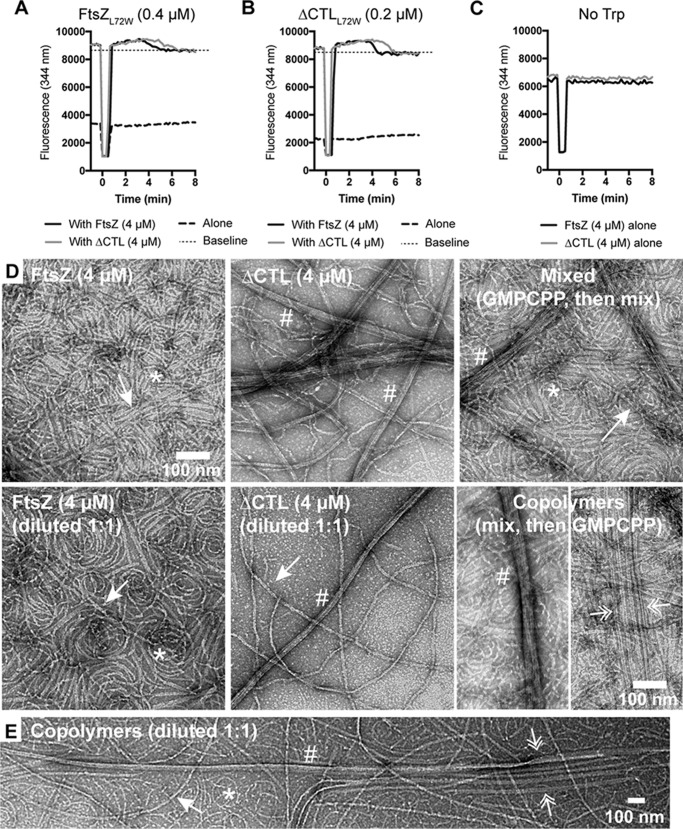
Figure 9.
FtsZ and ΔCTL can copolymerize to form very long bundles. A–C, tryptophan fluorescence increase (emission at 344 nm after excitation at 295 nm) for FtsZ CTL variants with 50 μm GTP (added at time = 0 min), 2.5 mm MgCl2, and 50 mm KCl. Straight black dotted line above 8000 indicating baseline after depolymerization has been included to better visualize the increase in fluorescence after addition of GTP because we observed a small but significant drop in intensity following the addition of GTP due to dilution of the proteins in solution. We define the baseline as the intensity following depletion of GTP. A, fluorescence signal from 0.4 μm FtsZL72W in reaction with 4 μm FtsZ or ΔCTL or by itself (n = 3). B, fluorescence signal from 0.2 μm ΔCTLL72W in reaction with 4 μm FtsZ or ΔCTL or by itself (n = 3). C, fluorescence signal from 4 μm FtsZ or ΔCTL (n = 1). D, electron micrographs showing polymers formed by FtsZ or ΔCTL individually, mixed together (after polymerization individually), or FtsZ/ΔCTL copolymers with 0.2 mm GMPCPP, 10 mm MgCl2, and 50 mm KCl spotted on EM grids 15 min after addition of GMPCPP and stained with uranyl formate. Mixed represents micrographs of 4 μm FtsZ and 4 μm ΔCTL polymerized individually and then mixed prior to spotting on grids. FtsZ (diluted to 1:1) or ΔCTL (diluted 1:1) represent polymers obtained by diluting GMPCPP-stabilized polymers of 4 μm FtsZ or ΔCTL, respectively, with polymerization buffer (1:1 dilution) prior to spotting on grids. Copolymer represents micrographs of polymers formed by FtsZ (2 μm) and ΔCTL (2 μm) both in the same reaction mixture (total FtsZ variant concentration, 4 μm) with GMPCPP. E, low magnification micrographs of copolymers formed by 2 μm FtsZ and 2 μm ΔCTL (initial total FtsZ variant concentration, 4 μm), diluted 1:1 with polymerization buffer (final total FtsZ variant concentration, 2 μm) following 15 min of incubation with 0.2 mm GMPCPP, 10 mm MgCl2, and 50 mm KCl prior to spotting on grids. Dilution of GMPCPP-stabilized polymers reduces crowding on EM grids and helps in better visualization of polymer structures. Scale bar, 100 nm. *, single protofilaments; arrow, two- or three-filament bundles; #, multifilament bundles; pair of double arrowheads, groups of two- or three-filament bundles that run parallel.

