Figure 7.
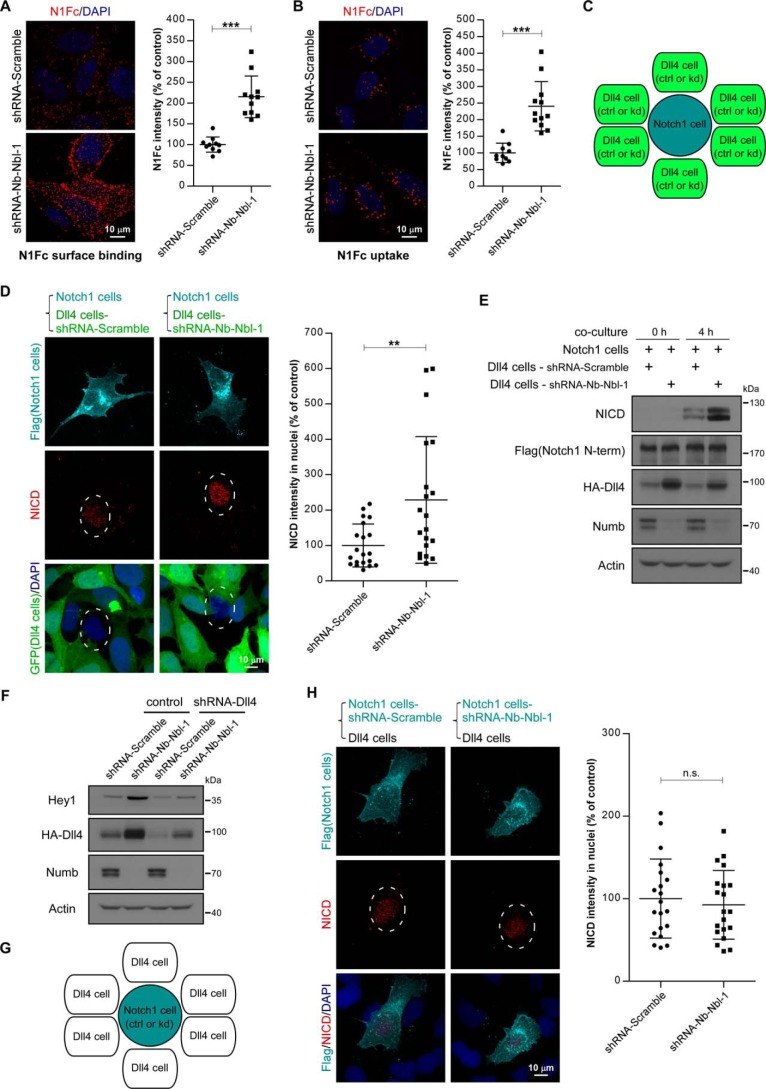
Numb/Numblike knockdown activates Notch signaling in neighbor cells via promoting cell-surface recruitment of Dll4. A and B, representative images showing binding (A) and uptake (B) of soluble N1Fc by AD293-HA-Dll4 cells treated with the indicated shRNAs. Quantifications of N1Fc immunofluorescence intensity are shown in A and B, respectively. Each data point is expressed as a percentage relative to that in control cells. (n = 10–12 microscopic fields for each condition, means ± S.D.) ***, p < 0.001. C, schematic representation of co-culture assay for assessment of Notch activity as shown in D and E. Notch1 cells were co-cultured with control or Numb/Numblike knockdown Dll4 cells (GFP-positive) at a ratio of 1:10. Notch1 cells refer to AD293 cells stably expressing FLAG-Notch1, and Dll4 cells refer to AD293-HA-Dll4 cells. D, representative images showing double immunostaining of co-cultures for FLAG and NICD. The nuclei of Notch1 cells are encircled by dashed line. Intensity of NICD immunofluorescence in nuclei of Notch1 cells is quantified and shown in the right panel. Each data point represents integrated intensity per cell and is expressed as a percentage relative to that in Notch1 cells co-cultured with control Dll4 cells. (n = 20 cells). **, p < 0.01. E, Notch1 cells were co-cultured with control or Numb/Numblike knockdown Dll4 cells for 4 h. Notch activation was analyzed by immunoblotting as indicated. F, AD293 cells stably expressing HA-Dll4 were transfected with indicated shRNAs. Transfection-positive cells were selected by using 1 μg/ml puromycin and subjected to immunoblotting using the indicated antibodies. G, schematic representation of co-culture assay as shown in H. Control or Numb/Numblike knockdown Notch1 cells were co-cultured with Dll4 cells. H, representative images showing double immunostaining of co-cultures for FLAG and NICD. The nuclei of Notch1 cells are encircled by a dashed line. Quantification of NICD intensity in nuclei of Notch1 cells is shown in the right panel. Each data point represents integrated intensity per cell and is expressed as a percentage relative to that in control Notch1 cells. (n = 20 cells.) n.s. indicates no significance between two groups.

