Figure 2.
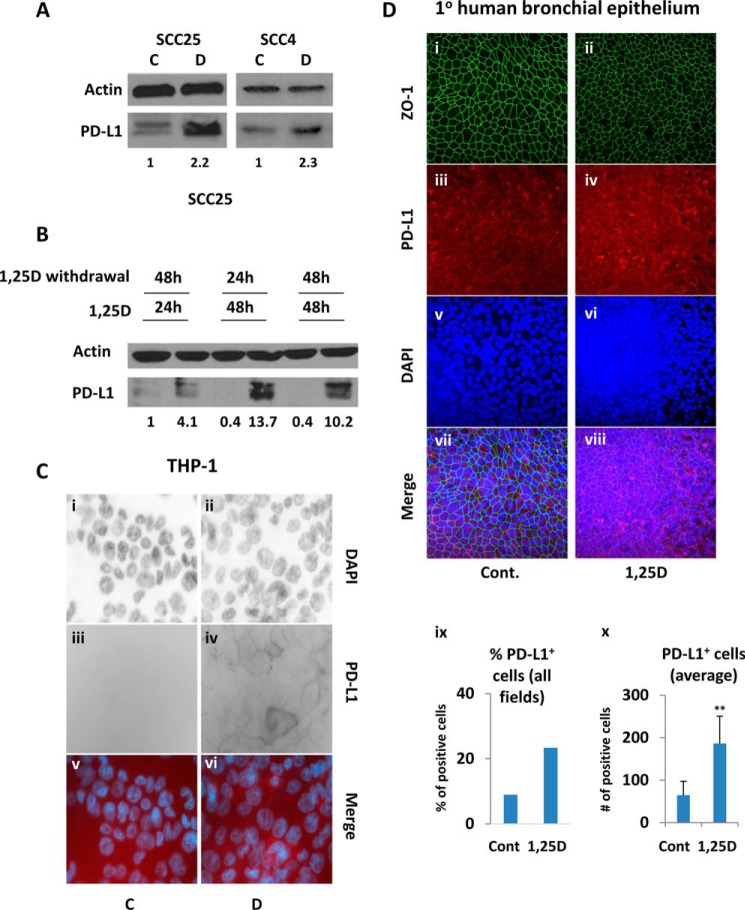
1,25D increases protein expression of PD-L1. A, analysis by Western blotting of PD-L1 expression in SCC25 and SCC4 cells following a 24-h exposure to 100 nm 1,25D (D) or ethanol (C). B, 1,25D-induced PD-L1 expression is stable in SCC25 cells after 1,25D withdrawal, as assessed by Western blotting. -Fold change relative to control and normalized to actin is indicated below each PD-L1 blot. C, wide-field microscopy for DAPI nuclear staining (i and ii) and PD-L1 expression (iii and iv) in differentiated THP-1 macrophages exposed for 24 h to vehicle (C) or to 100 nm 1,25D (D). v and vi, merge of the images. D, a compilation of z-stacks from several focal planes is presented from confocal microscopy for bronchiolar epithelium differentiation marker ZO-1 (i and ii), PD-L1 expression (iii and iv), and DAPI nuclear staining (v and vi) in primary bronchial epithelial cells treated for 48 h with vehicle (C) or with 100 nm 1,25D (D). vii and viii, merge for all images. ix, total percentage of PD-L1–positive cells across all seven fields. x, average number of PD-L1–positive cells from seven separate fields. ns > 0.05 ≥ 0.01 ≥ ** ≥ 0.001. Error bars, S.D.

