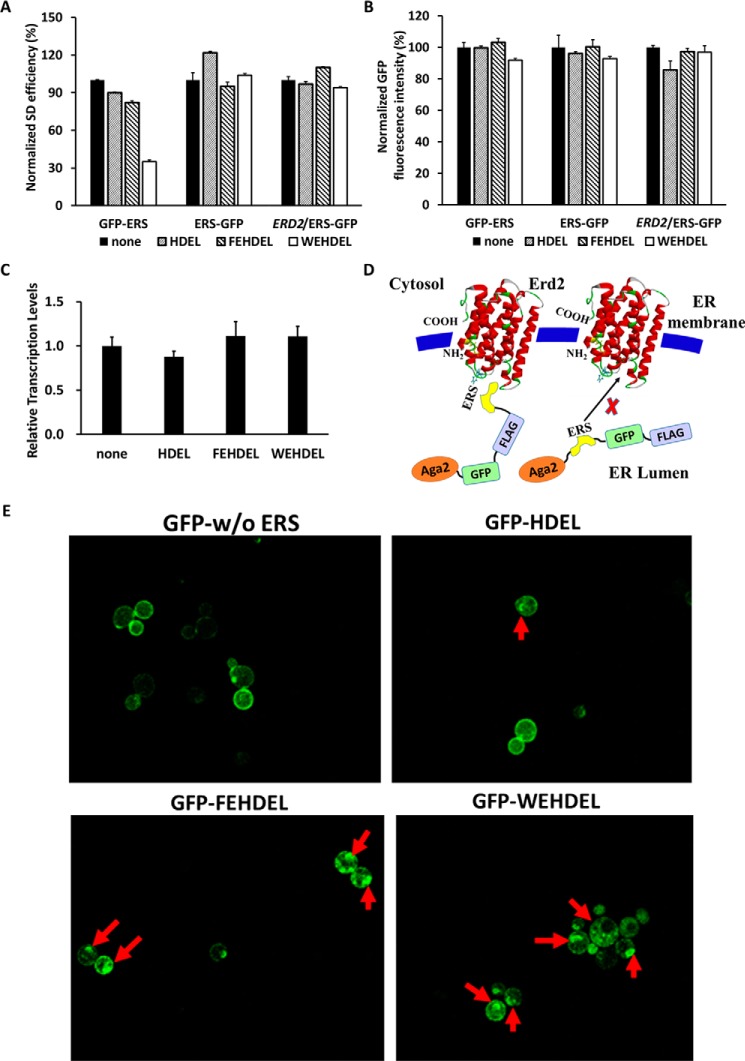
Figure 4.
Exploring the position of ERS in a protein for its interaction with ERD2. A and B, the normalized SD efficiency (A) or total cellular GFP fluorescent intensity (B) of the different Aga2–GFP–FLAG–ERS and Aga2–ERS–GFP–FLAG cassettes was analyzed after induction for 6 h at 30 °C. C, the in-cell mRNA levels of the Aag2–GFP–FLAG cassettes without ERS or with C-terminal ERS of HDEL, FEHDEL, and WEHDEL were quantitated by RT-PCR after induction for 6 h at 30 °C. D, the proposed scheme presents the interaction between Erd2 and ERS located at the C terminus of a protein complex. E, the intracellular and surface-localized GFP fluorescence of cells bearing the Aga2–GFP–FLAG or different Aga2–GFP–FLAG–ERS cassettes. The red arrows point to the accumulation of GFP fluorescence in yeast ER and Golgi. The cells were surface-labeled with iFluor 647–conjugated anti-FLAG antibodies for SD efficiency quantitation. In A and B, data are presented as mean ± S.E. (n = 3 independent experiments). p ≤ 0.05 (Student's t test).

