Figure 1.
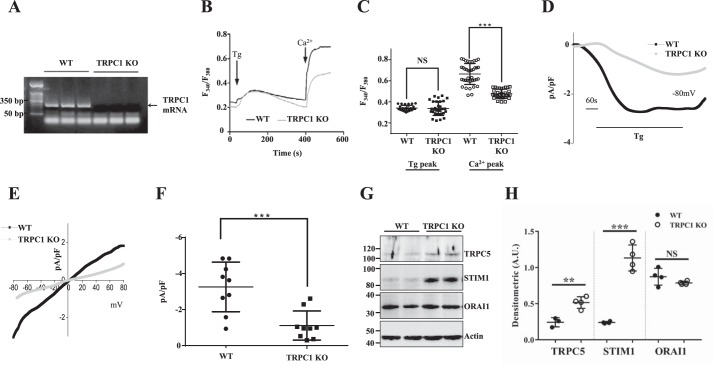
TRPC1 expression and Ca2+ signaling are decreased in subcutaneous adipose tissue of TRPC1 KO mice. A, RT-PCR expression of TRPC1 from subcutaneous adipose tissue of WT and TRPC1 KO mice following 12 weeks of diet and exercise. B, analog plots of the fluorescence ratio (340/380) from an average of 30–40 cells in each condition. C, quantification (mean ± S.D.) of 340/380 ratio. *** indicates significance (p < 0.001) versus control. D, thapsigargin (Tg)-induced currents were evaluated in adipocytes obtained from WT and TRPC1 KO mice. The holding potential for current recordings was −80 mV. E and F, I/V curves (mean current) under these conditions and the average (8–10 recordings) current intensity under various conditions is shown in F. *** indicates values (mean ± S.D.) that are significantly different from control (p < 0.001). G, subcutaneous adipose tissue from WT and TRPC1 KO mice were resolved and analyzed by Western blotting using antibodies labeled in the figure with β-actin as a loading control. H, quantification of each protein. Data are presented as mean ± S.D., n = 4. **, p < 0.01; ***, p < 0.001.

