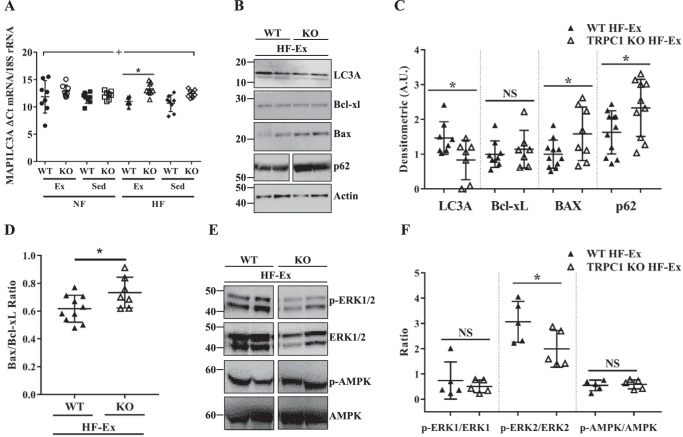
Figure 6.
Autophagy marker expression is decreased whereas apoptosis marker expression is increased in TRPC1 KO mice fed a HF diet and exercised. A, MAP1LC3A mRNA expression was measured from subcutaneous adipose tissue taken from WT and TRPC1 KO mice following 12 weeks of diet and exercise. Data are presented as mean ± S.D., n = 6–8. Significant (p < 0.05) effects from 3-way ANOVA are indicated by + (mouse type). A significant interaction was further analyzed using post hoc Tukey to perform pairwise comparisons. *, p < 0.05. B, subcutaneous adipose tissue from WT and TRPC1 KO mice fed a HF diet and exercised was resolved and analyzed by Western blotting using antibodies labeled in the figure with β-actin as a loading control. Quantification of each protein is shown in C. Data are presented as mean ± S.D., n = 7–11. *, p < 0.05. D, ratio of Bax/Bcl-xl is presented as a -fold increase of TRPC1 KO over WT values. Data are presented as mean ± S.D., n = 7–10. *, p < 0.05. E, subcutaneous adipose tissue isolated from WT and TRPC1 KO mice fed a HF diet and exercised was resolved on SDS-PAGE gels and analyzed using different antibodies as labeled in the figure. F, quantification of the phosphorylated to non-phosphorylated form of each protein. Data are presented as mean ± S.D., n = 5. *, p < 0.05.

