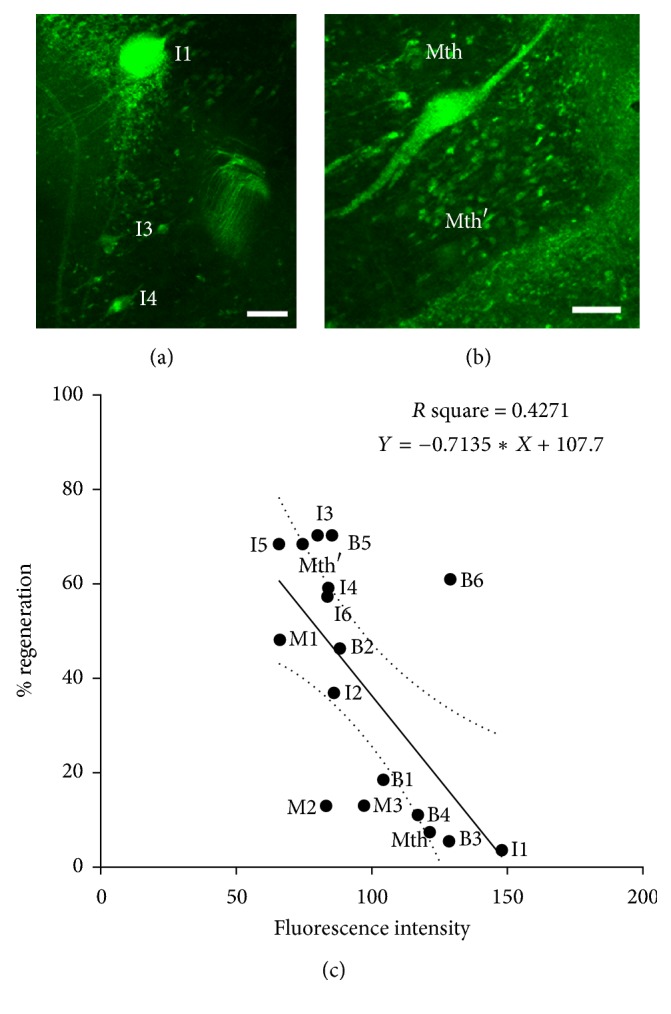
Figure 1.

Confocal photomicrographs of dorsal views of whole-mounted brains of larval sea lampreys showing FAM-VAD-FMK labeling in axotomized identified spinal-projecting neurons 2 weeks after SCI. (a) I1, I3, and I4 neurons. (b) Mth and Mth′ neurons. Note that fluorescence intensity in I1 and Mth neurons is higher than I3, I4, and Mth′ neurons. Rostral is to the top and the ventricle is to right in all figures. (c) Linear regression analysis shows the inverse correlation between the regenerative ability of identified SC projecting neurons and their fluorescence intensity reflecting caspase activation (95% confidence intervals for slope −1.168 to −0,2588; Sy.x = 20.50; p = 0.0044). The dotted lines indicate the 95% confidence interval. Identity of RS neurons is shown adjacent to their corresponding data points. I1, I3, and I4: Müller cells of the isthmic region; Mth: Mauthner cell; Mth′: auxiliary Mauthner cell. Scale bars: 50 μm.
