Figure 4.

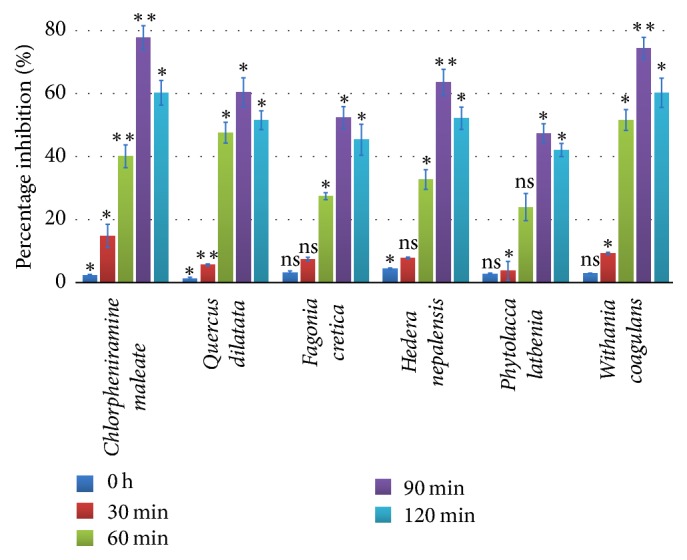
Percentage inhibition in histamine assay at different time intervals. Values expressed in mean ± SD with statistical significance ∗p < 0.05, ∗∗p < 0.01 where “ns” represents nonsignificance.

Percentage inhibition in histamine assay at different time intervals. Values expressed in mean ± SD with statistical significance ∗p < 0.05, ∗∗p < 0.01 where “ns” represents nonsignificance.