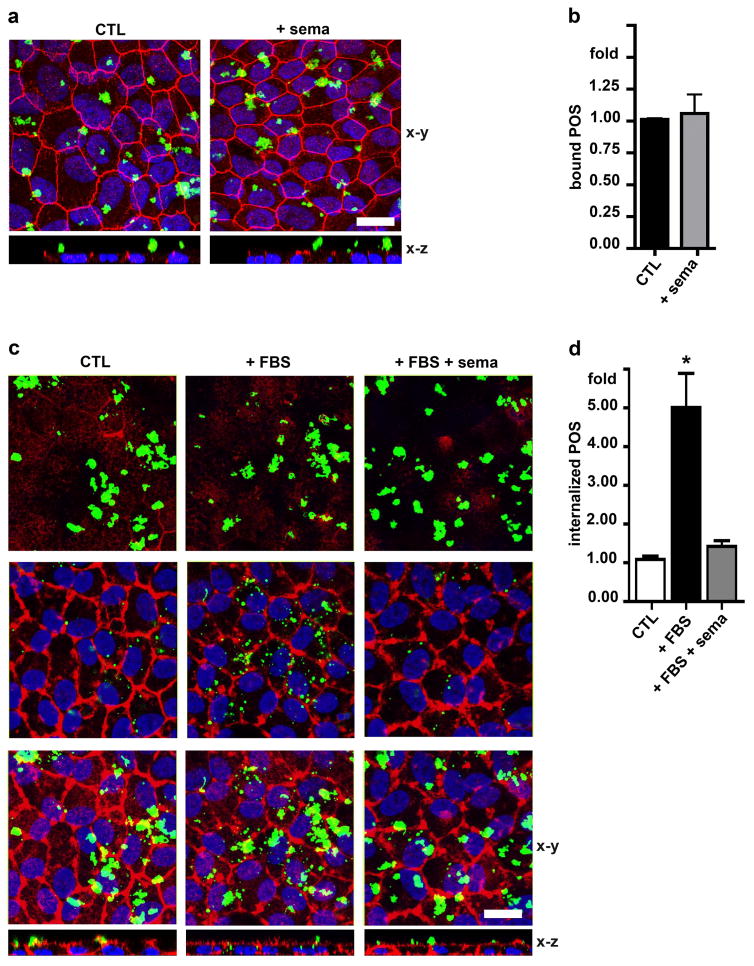
Fig. 1.
Sema4D inhibits POS internalization without affecting POS binding. a Maximal projections of x-y confocal image stacks and a select x-z plane as indicated showing ZO-1 (shown in red), cell nuclei (shown in blue) and bound POS (shown in green) at the apical surface of hRPE cells fixed and stained following incubation with DMEM (CTL) or sema4D (+ sema) in DMEM for 1 hour at 37°C. b Quantification of bound POS after experiments as in a. c X-y images and select x-z planes showing F-actin labeling (shown in red) and POS (shown in green) internalized after incubation for 4 hours at 37°C with DMEM (CTL), DMEM with 10% FBS (+ FBS) or DMEM with 10% FBS and sema4D (+ FBS + sema). Upper row shows x-y planes at the apical surface of hRPE with bound POS, center panels shows x-y planes at the cell center with internalized POS, and lower row shows maximal projections representing the cells in their entirety. Representative fields are shown from a total of three independent experiments. d Quantification of internalized POS after experiments as in c. All bars show mean ± SD of three independent experiments with duplicate samples each. Asterisks indicate significant difference to control cells, p < 0.05 by ANOVA. Scale bars: 10 μm.

