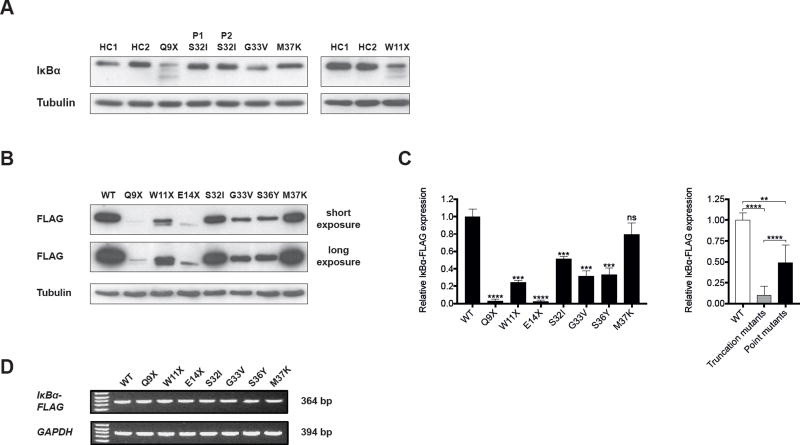
Figure 2. Expression of IκBα in fibroblasts and transfectants.
A. Representative immunoblot of IκBα expression in cultured skin-derived fibroblasts from healthy controls (HC) and AD EDA-ID patients (P). P1 S32I and P2 S32I are patients 1 and 3 in Table I. B, C. Representative immunoblot (B) and quantitative analysis (C) of the expression of Flag-tagged WT and mutant IκBα in transfected HEK293T cells. Results in the left panel of C are expressed as the mean ratio of IκBα to tubulin of each individual mutant analyzed, relative to the mean of WT IκBα set at 1.0. Results in the right panel of C are expressed as the mean ratio of IκBα to tubulin of pooled IκBα truncation mutants and pooled IκBα point mutants relative to the mean of WT IκBα set at 1.0. D. RT-PCR analysis of mRNA encoding FLAG-tagged WT and mutant IκBα. The amounts of cDNA used were in the linear range determined for mRNA encoding FLAG-tagged WT IκBα. Data is representative of three independent experiments. Columns and bars represent the mean±SD of at least three independent experiments. **, p< 0.01; ***, p<0.001; ****, p<0.0001; ns, not significant.

