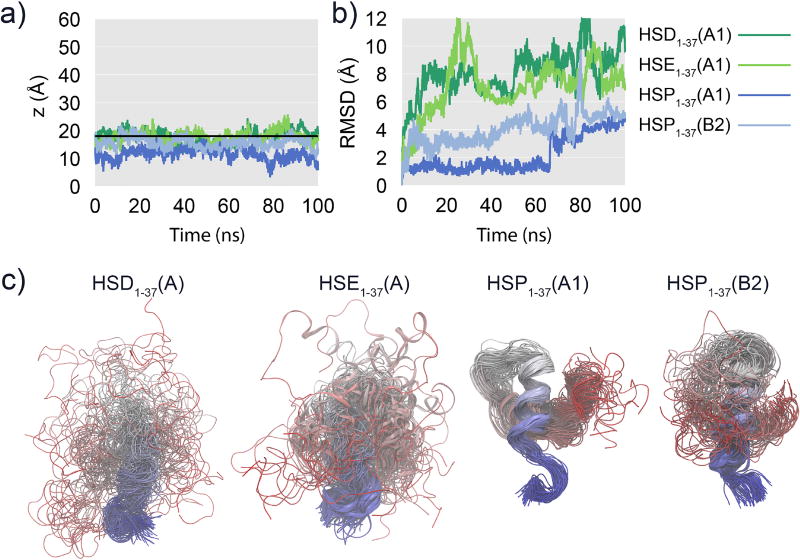
Figure 10.
a) Minimum z-coordinate and b) RMSD for the DOPC/DOPS simulations to the final snapshot of the HMMM simulations. The black horizontal line indicates the position of the lipid phosphates. c) Alignment of the peptides using Ca atoms of residues 1–19 from the DOPC/DOPS simulations that were extended from the HSD1–37(A), HSE1–37(A), HSP1–37(A1), and HSP1–37(B2) HMMM simulations. The peptides are colored by residue number going from the N-terminus colored blue to the C-terminus colored red. Each alignment contains one structure per 0.1 ns.

