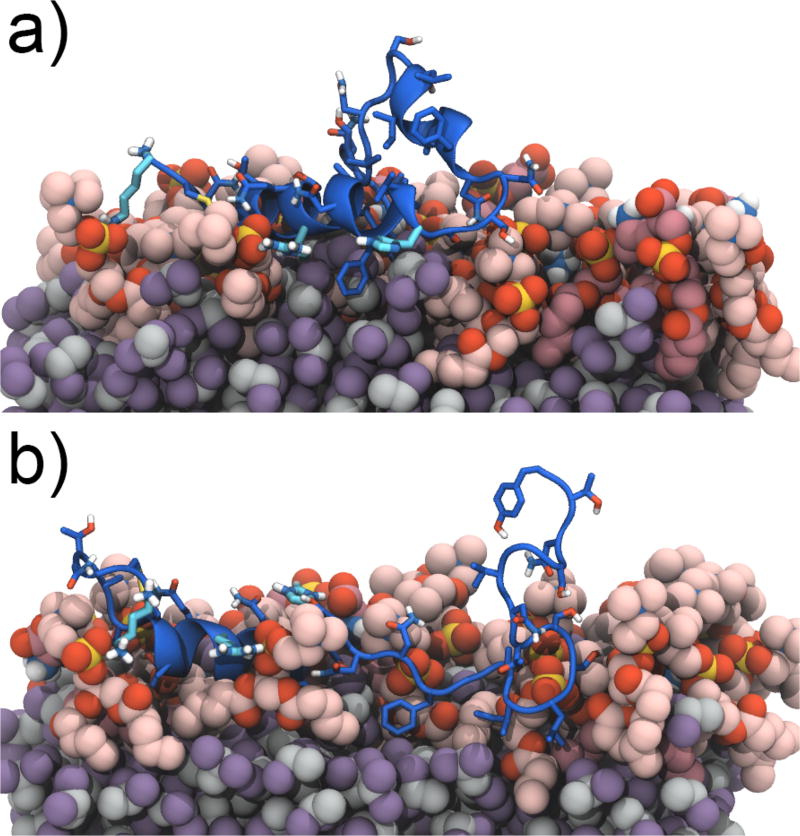
Figure 5.
Representative structures of a) HSE1–37(B) and b) HSP1–37(A1). The structures are from the largest and second largest cluster, for HSE1–37(B) and HSP1–37(A1), respectively, from a clustering analysis performed using VMD (Figure S3). Both clusters contain the final structure of the simulation. The lipids are shown in red colors, DCLE is shown in grey and purple, and the peptide is shown in dark blue. The final frames of all hIAPP1–37 peptides bound to the HMMM membrane are provided in Supporting Information.

