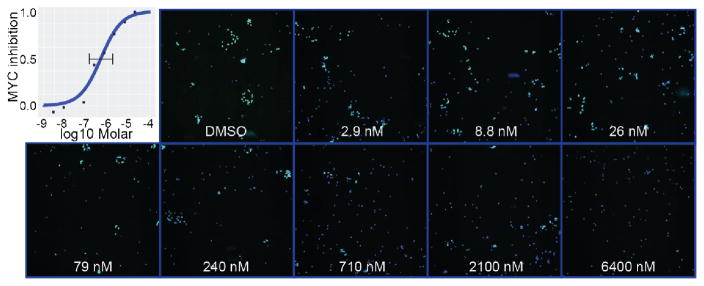
Figure 4. Quantification of c-MYC protein levels.
HD-MB03 medulloblastoma cells (nuclei in blue) were treated with either DMSO, or increasing concentrations of compound 9, then fixed and stained for c-MYC expression after 72 hours. Immunofluorescence with an antibody against c-MYC shows decreased levels of the protein (green) with increasing concentration of compound when compared to the DMSO control. Images acquired at 10x.

