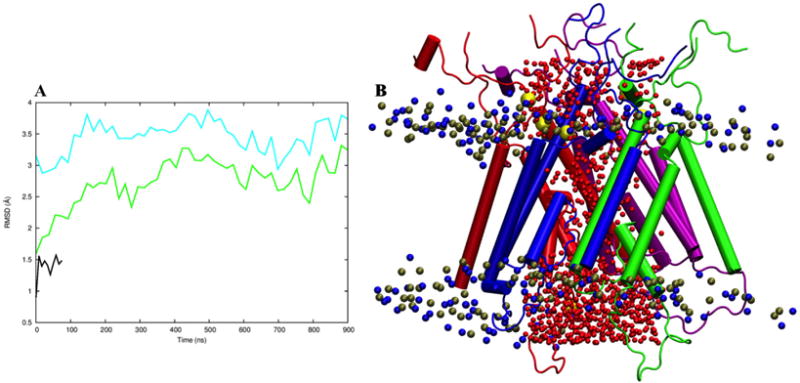
Fig. 2.

Refinement simulation of the open TMD in explicit membrane. (A) The Cα RMSD of the M3 bundle as a function of simulation time, referenced to either the closed structure 4TLM (cyan curve) or to our initial open model from helix repacking (green curve). Also shown is the Cα RMSD of the M3 bundle in the simulation of the closed TMD (black curve). (B) A snapshot at 544.9 ns of the simulation of the open TMD. The two GluN1 subunits are colored in blue and purple; the two GluN2B subunits are in red and green. Oxygen atoms of water molecules in the pore, P and N atoms in POPC headgroups, and sodium ions are shown as spheres colored in red, ochre, blue, and yellow, respectively.
