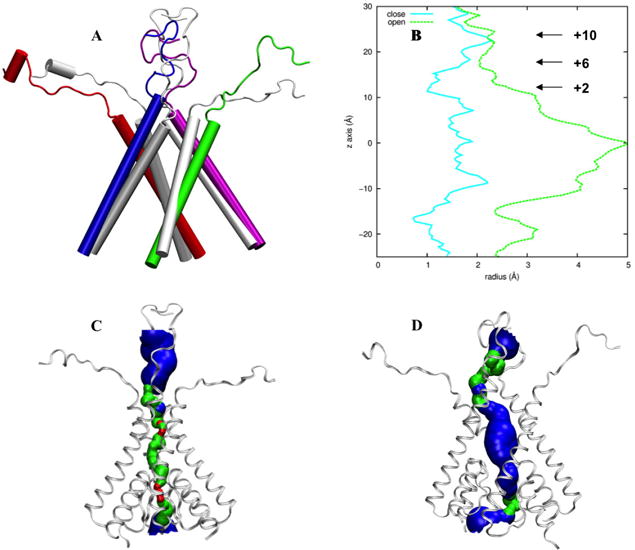
Fig. 3.

Comparison of the TMD closed structure 4TLM and the refined open model. (A) The M3 helices and the M3-D2 linkers. The closed structure is shown in gray whereas the open model in color. (B) Pore radius along the channel axis. The horizontal arrows indicate the positions of three residues forming the activation gate. The numbers are those defined according to the conserved sequence SYTANLAAF, with the residue “S” at number 0. (C) “HOLE” image (Smart et al., 1996) of the closed structure. (D) HOLE image of the open model.
