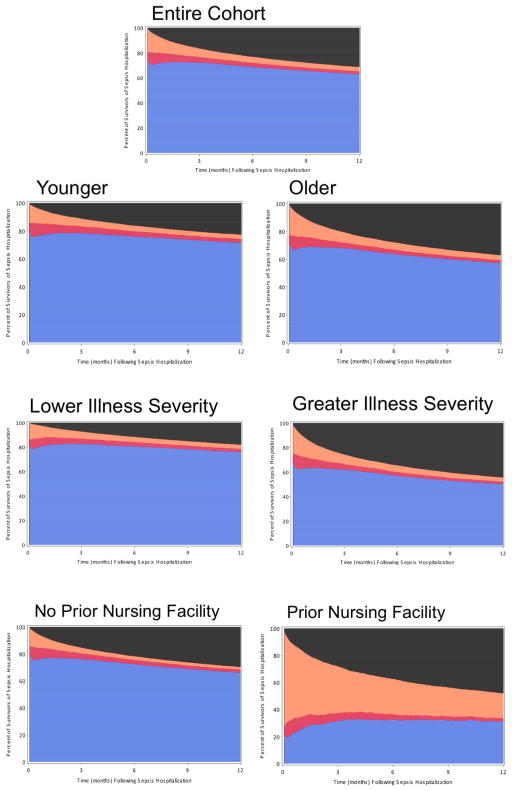
Figure 1.
Healthcare Facility Use and Mortality in the Year Before and After Sepsis Hospitalization, Overall and by Subgroups
This figure shows the daily location of 26,591 sepsis survivors in the year after sepsis hospitalization. The index sepsis hospitalization is not included; the year after begins the day after hospital discharge. Patients are depicted as being at home (blue), admitted to a hospital (red), admitted to an LTAC or nursing facility (orange), or dead (black).

