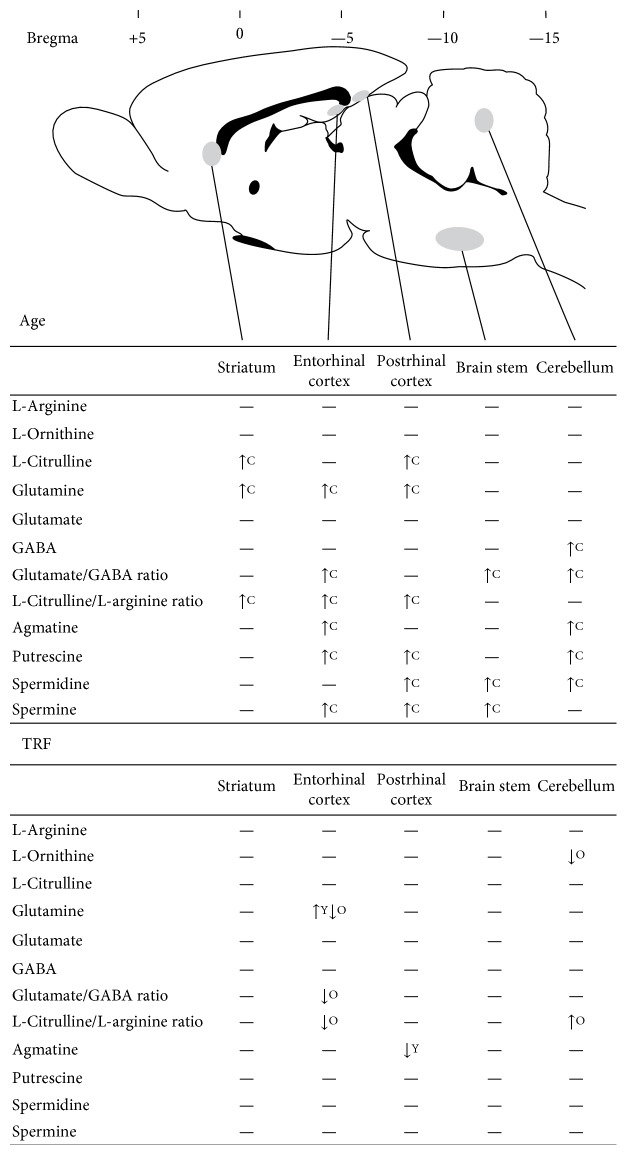
Figure 3.
Summary of the effect of age and TRF on amino acid (L-arginine, L-ornithine, L-citrulline, glutamine, glutamate, GABA, glutamate/GABA ratio, and L-citrulline/L-arginine ratio) and polyamine (agmatine, putrescine, spermidine, and spermine) levels in the striatum, postrhinal cortex, entorhinal cortex, brain stem, and cerebellum. Decreased levels are shown by downward arrows and increased levels by upward arrows. No changes are indicated by a horizontal dash. C represents the effect of age on control groups; Y represents the effect of TRF on young groups; O represents the effect of TRF on old groups. Adapted from the rat brain atlas [67].

