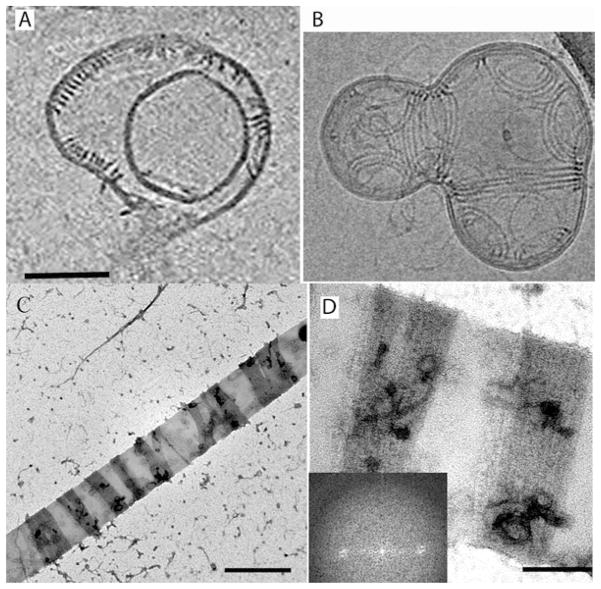
Fig. 5.5.
Panel A shows a section through a cryoEM tomogram of Z rings reconstituted from FtsZ plus FtsA. The left side of the vesicle shows two Z rings in oblique section. They each comprise ribbons of pfs spaced ~7.5 nm apart. Panel B shows a projection of a an entire vesicle, with ribbons of 3 and 4 protofilaments forming arcs encircling sites of constriction (Reprinted from Szwedziak et al. 2014, with permission of the authors. a was extracted from their video 4, b is their Fig. 5.3c)Panels C and D show negative stain images of inside-out Z rings of mts-FtsZ, reconstituted on rigid lipid tubules. The dark stained Z rings comprise ribbons of parallel, close-packed pfs. The Fourier analysis (inset d) indicates a uniform 5 nm spacing of pfs (Reprinted from Milam et al. 2012 with permission of the authors). Scale bars are 100 nm (a, b) 500 nm (c) and 200 nm (d)

