Figure 5.
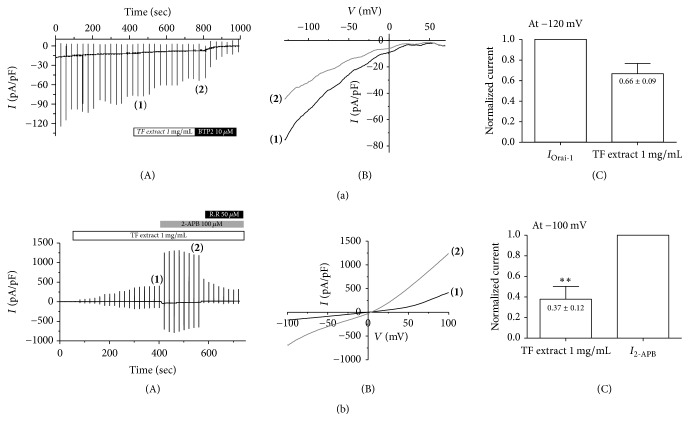
Effects of TF extract on calcium channels in HEK293T cells. Orai-1 current (IOrai-1) in HEK293T cells coexpressing Orai-1/STIM1 (a). Representative chart trace recordings of IOrai-1 currents (A). The number of parentheses represents steady state IOrai-1 (1) and its inhibition by 1 mg/mL of TF extract (2). Related I-V relationships of (1) and of (2) in (b). Summary of inhibition rate of IORAI1 by TF extract at −120 mV (C). The results are expressed as the mean ± SD (n = 3). ∗P < 0.05 versus IOrai-1. Effects of TF extract on activation of TRPV3 in HEK293T cells overexpressing TRPV3 (b). Representative chart recording of ITRPV3 activation by TF extract (A). The number of parentheses represents steady state TRPV3 current (ITRPV3) after TF extract treatment (1) and the maximal current induced by 50 μM 2-APB (I2-APB) (2). Related current-voltage (I-V) relationship curve at (1) and (2) from Figure 6(b). Normalized graph of ITRPV3 activation by TF extract and 2-APB at −100 mV (C). The results are expressed as the mean ± SD (n = 3). ∗∗P < 0.01 versus I2-APB.

