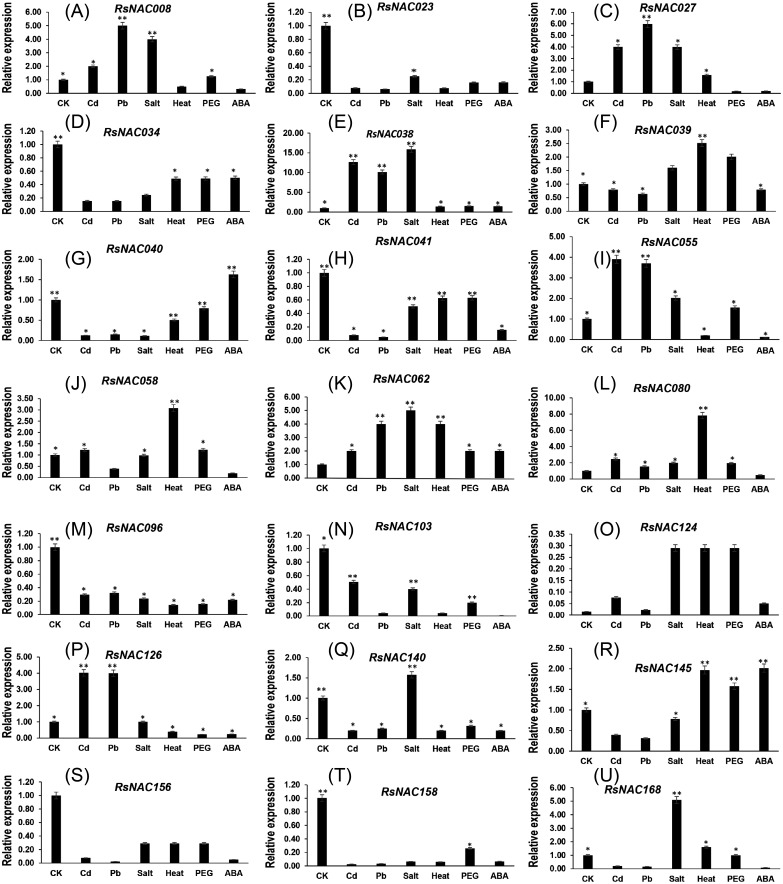
Figure 7. Expression patterns of RsNAC genes under abiotic stresses treatments.
RT-qPCR was used to analyze the expression profiles of 21 RsNAC genes under cadmium, lead, heat, salt, PEG, and ABA stress. CK is an untreated seedling. The Actin gene was used as an internal control. (A–U) represents expression patterns of the 21 RNAC genes in response to abiotic stresses, respectively. Error bars were obtained from three technical replicates. Asterisks indicate the genes significantly up-regulated or suppressed under abiotic stresses by t-test (* P < 0.05, ** P < 0.01).

