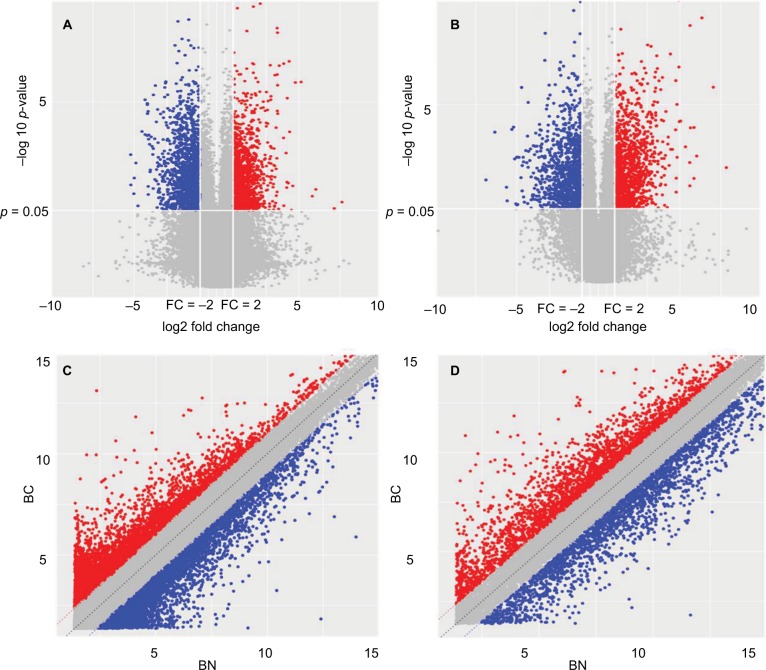
Figure 2.
Volcano plots and scatter plots demonstrating the heterogeneity between samples. (A, B) Volcano plots. The negative log of the p-value (base 10) was plotted on the Y-axis, and the log of the FC (base 2) was plotted on the X-axis. (C, D) Scatter plots. The values of the X and Y axes in the scatter plot are the averaged normalized signal values of the group (log2 scaled). The dash lines are FC lines. Red dots mean upregulated genes and blue dots mean downregulated genes.
Abbreviations: BC, breast cancer; BN, adjuvant nontumor breast tissue; FC, fold change.

