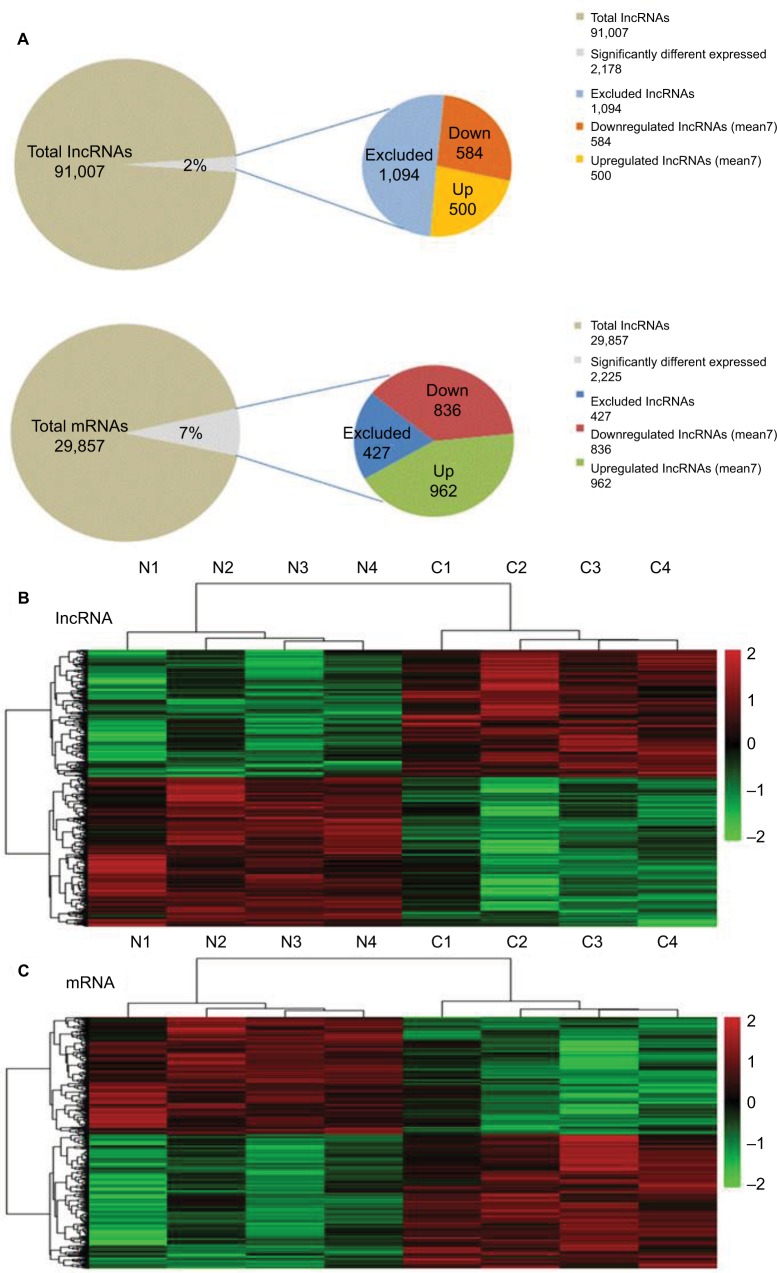
Figure 3.
Summary of microarray results.
Notes: (A) A total of 91,007 lncRNAs and 29,857 mRNAs were detected, of which 2,178 lncRNAs and 2,225 mRNAs were differentially expressed between two groups (FC >2 and p<0.05). (B, C) Hierarchical clustering map. Differentially expressed lncRNAs(B) and mRNAs(C)in BC and its paired adjacent tissues were analyzed using hierarchical clustering. Each row represents one lncRNA or mRNAs, and each column represents one tissue sample. The relative lncRNA expression is depicted according to the color scale. Red indicates upregulation; green indicates downregulation.
Abbreviations: BC, breast cancer; FC, fold change; lncRNA, long noncoding RNA.

