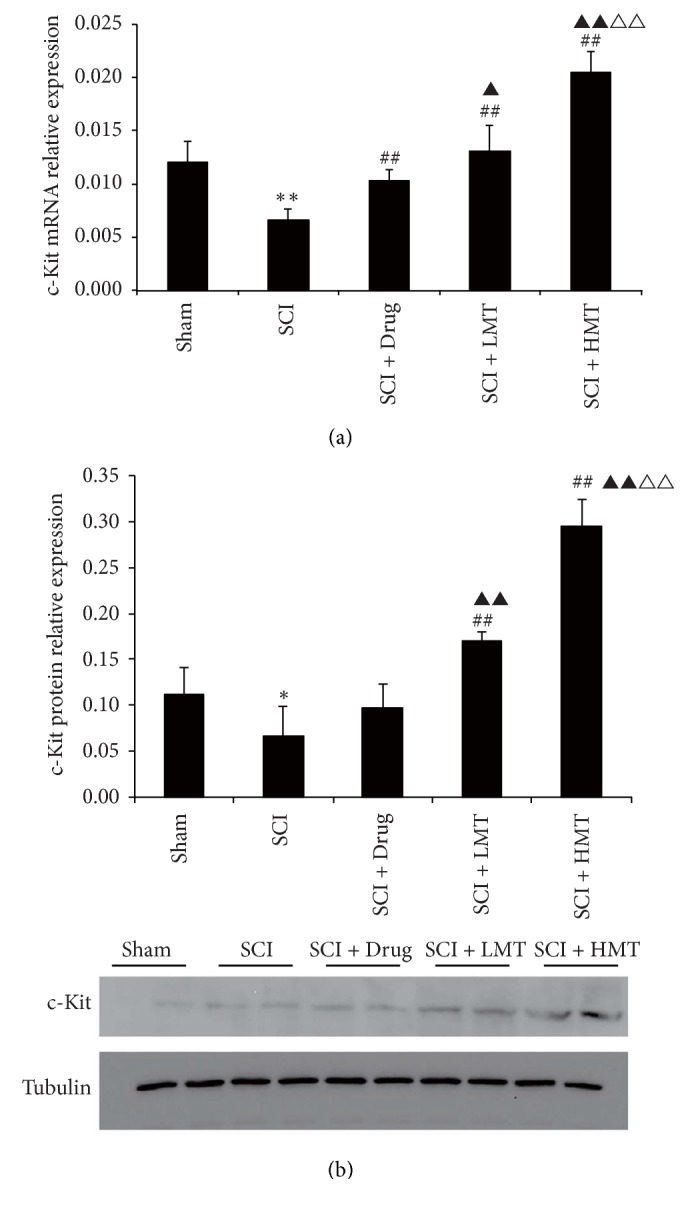
Figure 7.

Gene and protein expression levels of c-kit in different groups. After therapy, the gene expression levels of c-kit were evaluated by RT-PCR (a), normalized with the internal control GAPDH (n = 5). Western blot was used for c-kit protein level assessment, with tubulin as a loading control (n = 4). The sham, SCI, SCI + Drug, SCI + LMT, and SCI + HMT groups were analyzed. Representative western blot images are displayed in the bottom panel. ∗∗p < 0.01, the SCI group compared with the sham group; ##p < 0.01, compared with the SCI group; ▲p < 0.05 or ▲▲p < 0.01, compared with the SCI + Drug group; △△p < 0.01, compared with the SCI + LMT group. ∗p < 0.05.
