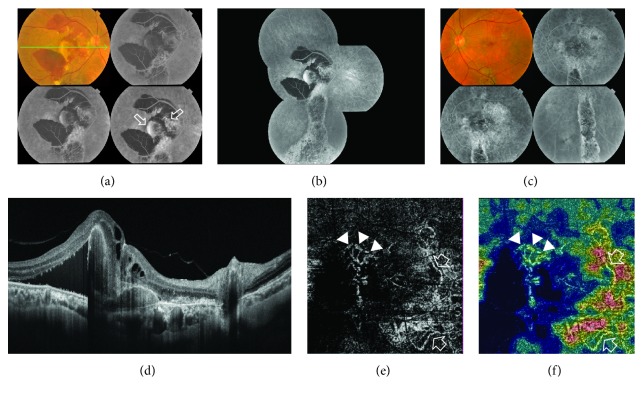
Figure 5.
(a) The colored photo and FFA of the right eye of a 61-year-old male with bilateral chronic CSCR of approximately 2.5-year duration. The posterior pole shows a subretinal yellowish-white elevated lesion in the macular area measuring approximately 2 DD. The lesion is surrounded by extensive subretinal hemorrhage that extends beyond the temporal vascular arcades. On FFA, there were two distinct patterns of hyperfluorescence. The first pattern corresponded to the yellowish-white lesion seen in the colored photo and consisted of early hyperfluorescence that gradually increased in intensity due to pooling into PED. The second pattern consisted of early stippled hyperfluorescence that increased in intensity throughout the angiogram resulting in an ill-defined hyperfluorescent area (open arrows). Note the blocked fluorescence corresponding to subretinal hemorrhage in the colored photo. (b) The composite FFA of the right eye shows extensive retinal pigment epitheliopathy in the macular area, extending inferiorly due to gravitation of subretinal fluid giving rise to the characteristic teardrop sign (atrophic RPE track). (c) The colored photo and FFA of the left eye showing diffuse retinal pigment epitheliopathy and the characteristic teardrop sign. (d) The radial scan SS-OCT of the right eye demonstrates neurosensory detachment along with subretinal hyperreflective heterogeneous material, sizeable subfoveal PED, and sub-RPE hyperreflective material. (e) The SS-OCTA of the right eye at the level of the outer retina in a 4.5 mm × 4.5 mm field revealed the characteristic hyperintense signal of a subfoveal neovascular complex composed of a main trunk with branching smaller vessels each terminating in polyp-like configuration reminiscent of PCV (arrow heads). In addition, there was another juxtapapillary larger neovascular complex composed of dense capillary arborization. At least two feeder vessels could be identified (open arrows). (f) The corresponding color-coded density map reflecting blood flow at the level of the outer retina. Note the intense red signal denoting high flow within the neovascular complexes seen, contrasting with the blue background typical of avascular outer retina.

