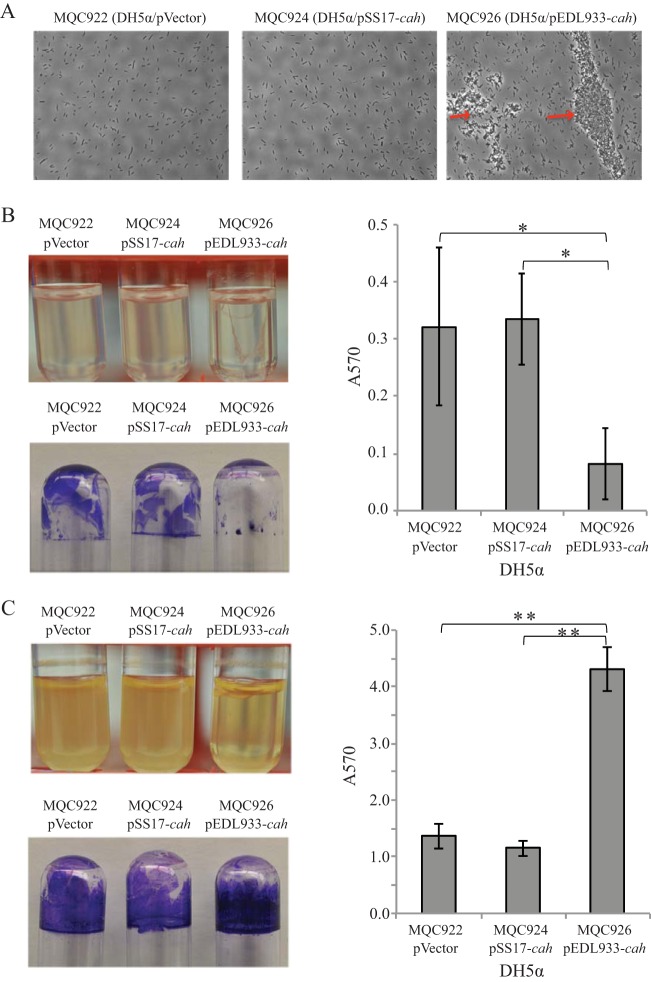
FIG 3.
Autoaggregation and biofilm formation by E. coli DH5α when cells were grown in LB broth. (A) DH5α cells visualized using a phase-contrast microscope at a magnification of 40×. The red arrows indicate the cell aggregates. (B) Results under static conditions: cultures of DH5α strains (upper left), crystal violet staining of the biofilm biomass on the glass culture tubes (bottom left), and quantitative assay of biofilms (right). (C) Results under agitated conditions: cultures of DH5α strains (upper left), crystal violet staining the biofilm biomass on the glass culture tubes (bottom left), and quantitative assay of the biofilms (right). Strain MQC922 is strain DH5α transformed with the expression vector pBBR1MCS and served as the control strain. Strain MQC926 is strain DH5α transformed with the cloned EDL933 cah, and strain MQC924 is the DH5α transformed with cloned SS17 cah (Table 2). Each data set represents the mean absorbance and standard errors of the means (SEM) from at least five biological replicates. Significant differences in means between a given strain and each of the two other strains by the t test are indicated with asterisks: *, P < 0.05; **, P < 0.001.

