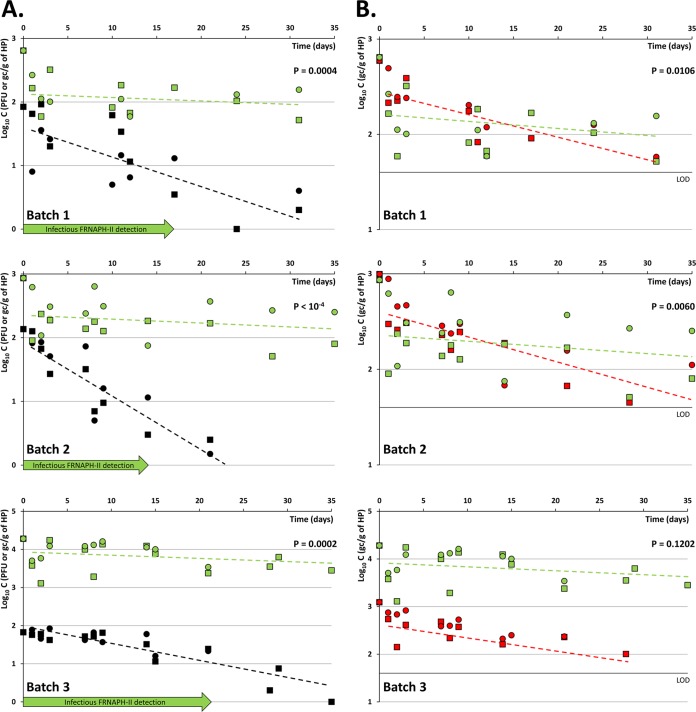
FIG 1.
Behavior of FRNAPH and NoV GII during oyster depuration processes. (A) Comparison of the decrease of FRNAPH infectious particles with that of the FRNAPH-II genome. (B) Comparison of the decrease of the NoV GII genome with that of the FRNAPH-II genome. The limit of detection was 40 gc/g of shellfish hepatopancreas (HP). Squares, storage in UV-treated seawater tanks; circles, storage in natural seawater; black symbols, FRNAPH infectious particles; green symbols, FRNAPH-II genome; red symbols, NoV GII genome; C, concentration. Dotted lines correspond to the log-linear decays observed after day 1. The P value corresponding to the t test for comparison of the two slopes is indicated in each graph.

