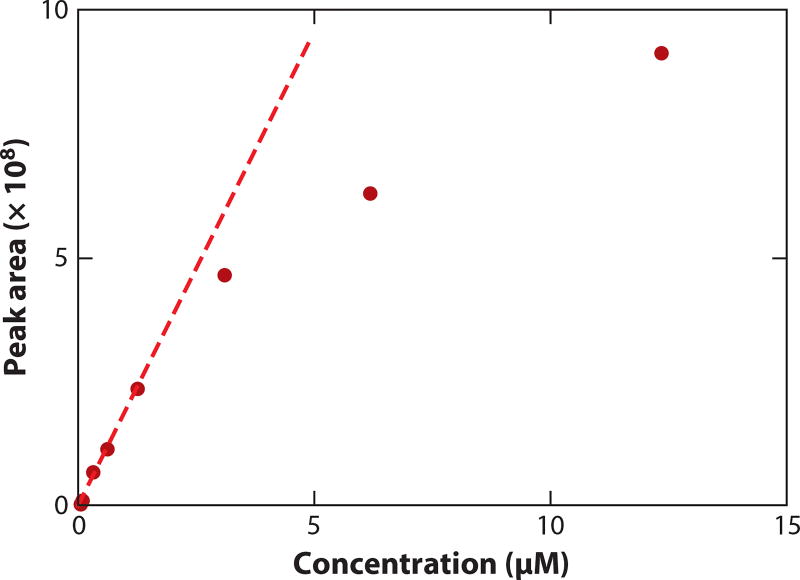
Figure 6.
Assessment of linearity. Plot of the liquid chromatography-mass spectrometry (LC-MS) peak areas (dark red dots) versus the concentration of the carnitine standard. The LC-MS method is reversed-phase chromatography on a C18 column coupled to a Q-Exactive plus mass spectrometer operating in positive ion mode. The signal is linear from 0.0005 to 1.2 µM and sublinear at higher concentrations.

