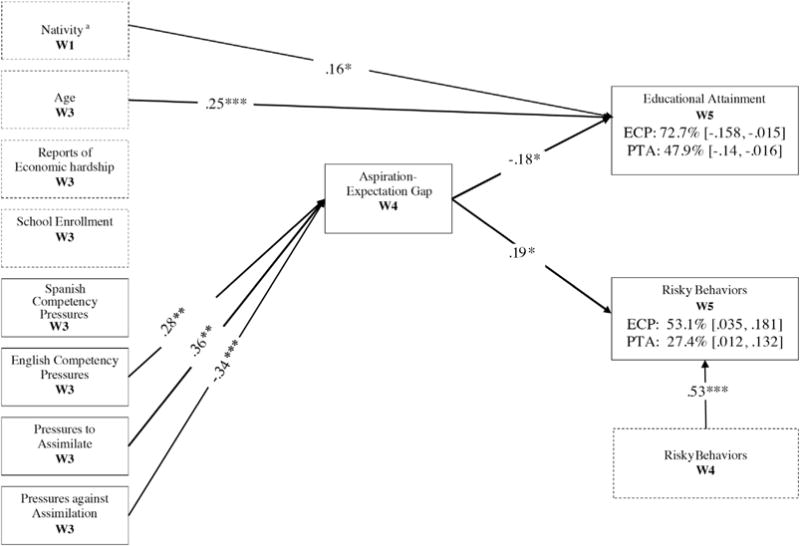
Fig. 1.

Model of predictors and outcomes related to the aspiration–expectation gap. Model fit indices: CFI = 0.99, χ2 (2) = 3.11, p = .21, RMSEA = .05 (.00–.16), SRMR = .02.
Note: Only significant paths are shown. Covariates are represented by dashed boxes. Bolded paths indicate significant mediation. Percentages signify the proportion mediated by the aspiration–expectation gap. 95% confidence interval for the mediated effect represented by brackets. W1 = Wave 1; W3 = Wave 3; W4 = Wave 4; W5 = Wave 5. a0 = Mexico-born, 1 = U.S.-born. *p < .05. **p < .01, ***p < .001. Sample presented here reflects the omission of 4 outliers whose education expectations exceeded their aspirations.
