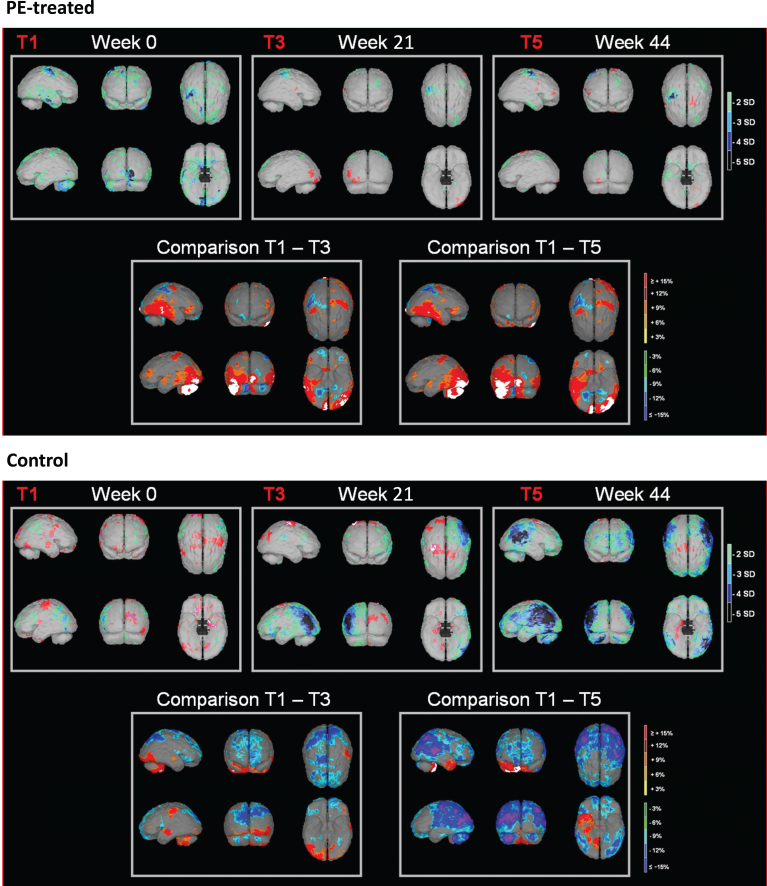
Fig.1.
Representative images of NeuroGam® analysis of brain perfusion in a plasma exchange [PE]-treated patient (upper panel) and an untreated control patient (lower panel). Color scale in images at week 0 (baseline, T1), 21 (end of treatment, T3), and 44 (end of follow-up, T5) indicates Z-score (number of standard deviations [SD] with respect to mean). Color scale in the images of T1–T3 and T1–T5 comparisons indicates the difference (increase or decrease) in percentage.

