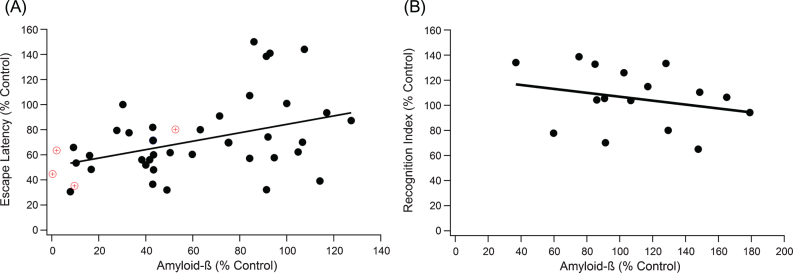
Fig.1.
Increases in Aβ plaque level weakly correlates with decline in performance in both the MWM and the NOR test. A) A positive trend indicates that as Aβ increases, cognitive performance declines (slope = 0.336, R2 = 0.149, n = 259, p < 0.001). The red target markers provide a visual reference for untreated wild type mouse measurements in comparison to 3xTg-AD control mice. B) NOR correlation results in similar significant, weak trends, where a negative trend indicates decreased cognitive function with increased Aβ (slope = –0.156, R2 = 0.064, n = 116, p < 0.05).

