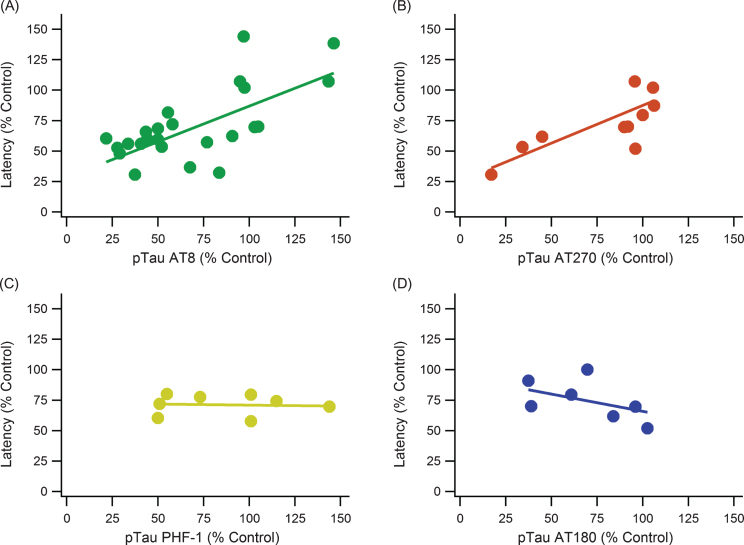
Fig.5.
pTau epitope analysis comparing different phosphorylation locations. pTau epitope breakdown shows strong positive correlations with AT8 and AT270 while showing no trend or a weak, negative trend with PHF-1 and AT180, respectively. A) AT8: slope = 0.586, R2 = 0.521, n = 185, p < < 0.001. B) AT270: slope = 0.619, R2 = 0.686, n = 88, p < < 0.001. C) PHF-1: slope = –0.017, R2 = 0.004, n = 48, p > > 0.05. D) AT180: slope = –0.285, R2 = 0.242, n = 44, p < 0.001. Note that sample sizes noticeably decreased from A to D due to a lack of data and measurements using the AT180 and PHF-1 markers.

