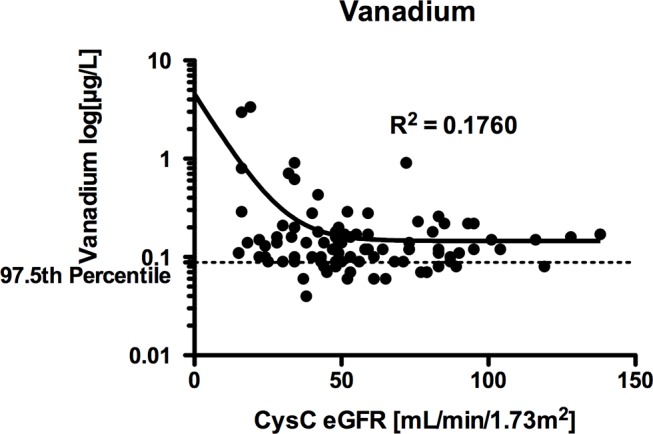
Figure 2.

Scatter plot of vanadium levels versus estimated glomerular filtration rate (eGFR). Vanadium levels (μg/L) were not normally distributed. The non-linear regression line (one-phase exponential decay) has been included. Glomerular filtration rate was measured in mL/min/1.73 m2. The formula reads: Y=(Y0−Plateau)×exp(−K×x)+Plateau, where Y0 is the value when x is 0, plateau is Y at a large value, K is the rate constant, and the values were Y0=4.555, Plateau=0.1457 and K=0.1111 (GraphPad Prism).
