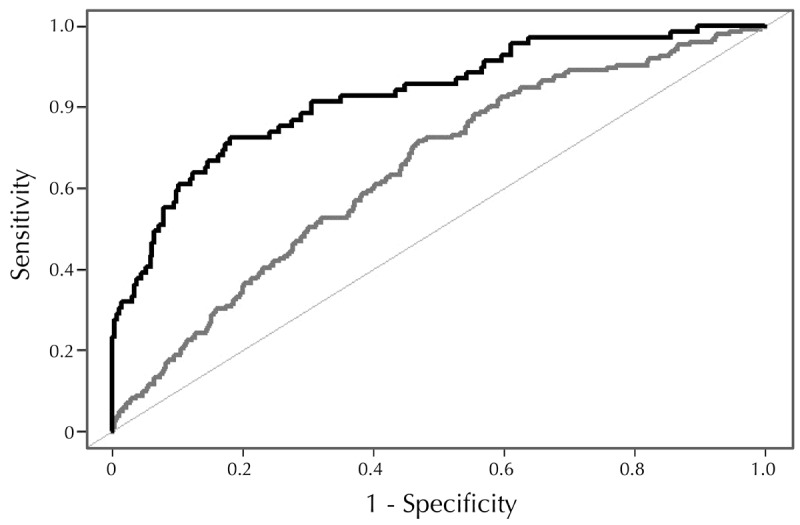
Figure 3.

ROC-plot for the screening panel consisting of basic maternal characteristics (i.e. prior risk), PAPP-A from aneuploidy screening, and three selected metabolites (arginine, glycine, and C5OH) from the MSMS panel (black curve). The grey curve includes prior risk only.
